Stratusphere UX is a comprehensive monitoring, performance validation and diagnostics solution for organizations that support physical, virtual and mixed-platform desktop environments. And for those of you involved in virtual desktop and virtual application delivery—specifically,  I’m referring to platforms and architectures such as VMware View and RDSH, as well as Citrix XenApp and XenDesktop—you know the care and feeding required to stay ahead of the curve and deliver a positive user experience is no easy task; there are blind spots aplenty.
Ultimately, being proactive with respect to these architectures is about keeping users happy, reaping operational efficiencies and being able to quickly remediate issues when things go bump in the night. In this post, I’d like to introduce you to Stratusphere 5.7, which is now generally available. I’d also like to take this time to share a few ways you can help eliminate some of these blind spots and extend visibility into your next-generation desktop.
With the release of Stratusphere 5.7, operations teams, next-generation desktop and applications architects now have an easier path to determining root causality with visibility that extends from the data center to the user end-point. As an aside, this visibility must also include the last mile; and to that end, Stratusphere UX also includes metrics and information on display protocols, such as ICA/HDX, RDP/RFX and PCoIP.
Sparkline Diagnostics Dashboard, Browsers, Inventory and Alerting
I’ll begin with an exciting and powerful collection of views located within our Advanced area of the product; a new graphical view we call Sparklines. These dashboard widgets offer a series of visual time and event-based views that are organized by themes such as desktop user experience, desktop applications, network applications, remote display, host and browser.  And while these trend charts and mini-tables provide visual performance and alerting cues, they serve a much more important role. These diagnostic dashboard views provide for faster remediation, allowing IT staff to keep users online and productive. Isn’t that what’s really important at the end of the day?
You can get a sense of how these Sparkline views operate in a recent post entitled, “Stratusphere UX 5.7 Sparkline Dashboards Common Workflows.”
Next, I’d like to talk about the Web browser metrics in this new release. Browsers have become a pervasive desktop application, supporting everything from local access to business-critical applications to those hosted in the cloud. Stratusphere 5.7 now provides visibility into the browser, with metrics and information to support domains, hosts and URLs being accessed by users.
When browser performance comes into question, the majority of application performance monitoring (APM) and other next-generation in-guest desktop monitoring solutions will simply point a finger at the Web browser as a constrained application. But how do you qualify and determine if a user is having a bad experience when accessing Salesforce.com versus Facebook? With Stratusphere 5.7, Liquidware Labs can now peel back the layers of the browser experience and help you to determine if there is a VM resource issue, a broad Web infrastructure or website problem, or a user training opportunity.
Flowing Information Where it’s Needed
Back a few months ago, we announced the availability of the Stratusphere API (see “Extend Visibility with the Stratusphere API.” Since then, customers, partners and professional services organizations have been leveraging our API to automate operational tasks and reporting efforts that are seen by Stratusphere.
Customers with existing operational processes and monitoring tools can feed the granular user, machine and application metrics from Stratusphere into their framework of their choice. This powerful and flexible addition to Stratusphere has allowed our customer’s to extend the metrics and information they depend on—and at the same time, provide the additional benefit of being able to integrate and consolidate views of the data within existing operational monitoring tools.
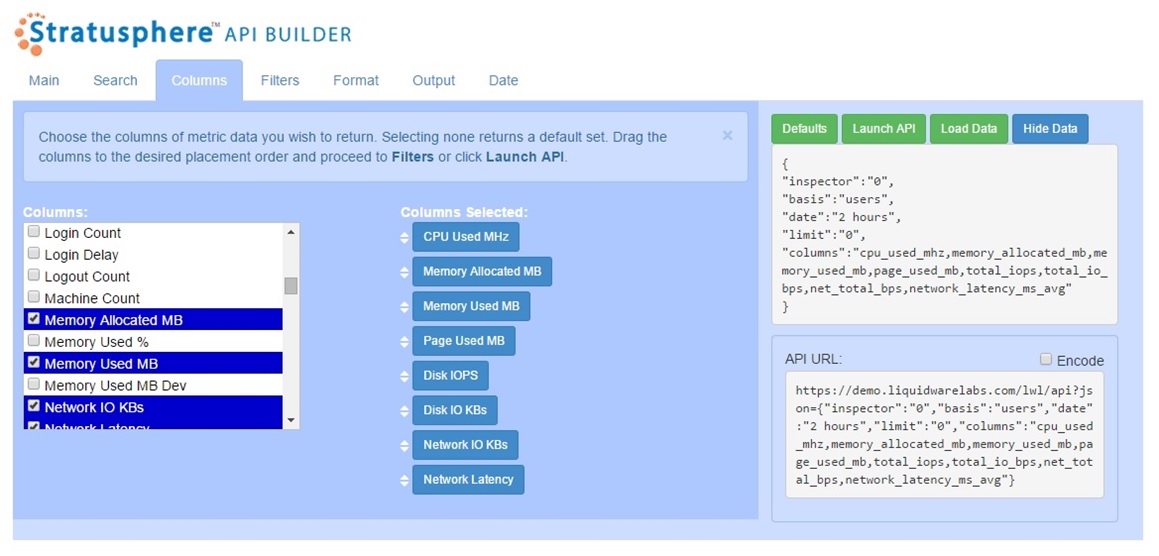
With Stratusphere 5.7, we’ve created a new web-based user interface to harness and formulate user experience, machine and application-centric data queries with greater efficiency and ease. The Stratusphere API Builder can be accessed simply by pointing your browser at https://{your.servername.com}/apibuilder/ (specific IP addresses and/or subnets must be authorized in Stratusphere Administrative interface).
The Stratusphere API has also provides a significant benefit to Liquidware Labs partners and other organizations who count on the metrics and information gathered by the Stratusphere architecture in their services practices. In addition to integration with other operations and management tools, the API allows for the seamless exporting of Stratusphere data into a host of formats including Microsoft Excel, CSV, HTML and JavaScript Object Notation (JSON). To date, partners have created rapid prototyping tools to support the creation of a bill of materials; based upon real-world Stratusphere FIT assessment data. Related, existing customers are leveraging the API to generate ad hoc reporting of inventory, performance metrics and other data generated by Stratusphere UX in an easy to manipulate Excel format, saving countless hours compiling reporting and detail to support IT operations and reporting.
As you travel the road towards the next-generation workspace, whether that means gaining visibility into existing physical PCs, delivering targeted and strategic applications through RDSH, or virtualizing the entire desktop with VDI, make sure you set your mirrors to avoid blind spots—they exist, and will catch up with you.
I’d like to hear about your next-generation visibility challenges. Tell me about your approach, or how you were caught off guard while going around the bend. If I like your story, I may be able to hook you up with a 25-pack of Liquidware Labs products. Safe travels!


Leave A Comment
You must be logged in to post a comment.