In the release of Liquidware Labs Stratusphere UX 5.6 there are two key enhancements made to the Preview Inspectors. They are, first the addition of Filtering and second the enhancement of Inspector Views. These new updates continue to make the Preview Inspectors more robust with more flexibility. They provide you the ability to get to the exact data required easier and faster.
Filtering
When working with the Preview Inspectors you have a significant amount of flexibility in how you display and work with your data. The Filtering option expands on this and gives you more granular control over exactly what information is critical to your analysis. For example, suppose you want to be aware of any desktop who’s CPU usage is exceeding 33% or users who are getting application load times greater than 10 seconds. The Filtering option provides you exactly that. It enables the Preview Inspectors to just show the data results that meet the criteria of the filters applied. Now you can zero in on the desktops, users and applications of interest.
To apply a filter or multiple filters click the Filter button on the main options bar to display the Filter window.
![]()
This opens up all of the pre-defined Output Filters created within the Preview Inspectors. They are organized by various groupings. For example, filters that applies to User Experience (UX) metrics. Simply select the filter or filters you wish to apply and hit the Go button.
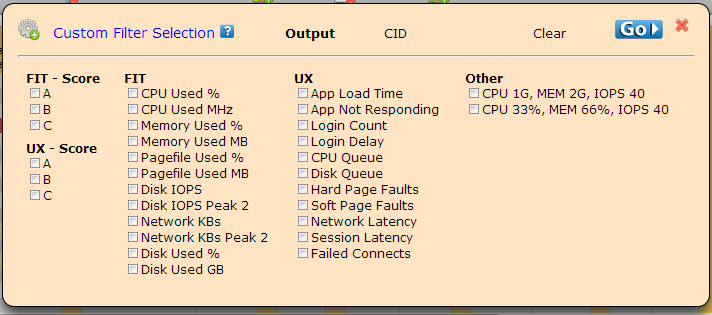
To clear your selection and apply new filters you can use the Clear link. The Output link shows all of the defined Filters that can be applied to the data output of the Inspector and View you are running. For example, if you selected Machines for yesterday and now you want to filter that output to only those machines with CPU >= 33%. Just apply the CPU% Used filter. While the CID link provides additional advanced filtering options that changes your base data selected from the Connector ID (CID) records. For example, you may only want to see ‘Physical Machine’ records returned.
Using pre-defined filters are great but it gets even better. There are many different pre-defined filters available with default values. Looking the CPU Used Percent filter it is defaulted to looking at desktops where the CPU is greater than 33%. ![]()
But for your environment you may really want to look at CPU greater the 50%. You do this very easily. Click into the ‘Filter Detail’ breadcrumb and change the value to 50. Then refresh the page and you are now filtering by CPU percent greater the 50%. It is that simple.
![]()
In this below example we have applied two filters which are indicated by the ‘Filter Detail (2)’ in the breadcrumb line. In this case it is login count > 1 and application load time >= 10.
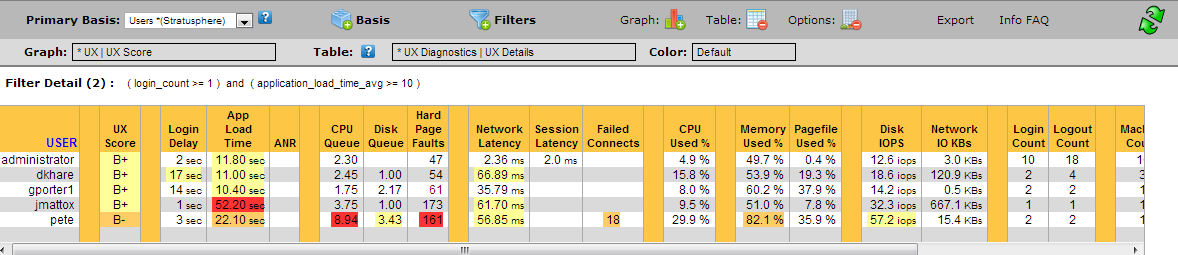
As you can see Filtering is very powerful within the Preview Inspectors and provides you with great ability to slice and dice your data for exactly your analysis needs.
Inspector Views
The Preview Inspectors provides many ways in which you view and access the Stratusphere metric data. The Inspectors provides this through various basis selections (how your data is grouped), graphs, tables, filters and other available options. By applying these various options you now have almost endless possibilities in the different ways you can analyze and work with your data. This is very cool.
In Stratusphere UX 5.6 we are introducing an updated approach to Views. A Preview Inspector View will take all of the flexibility the Preview Inspectors provide and package them together in specific Use Case views of the most popular ways you would want to look at your data. They also can apply set rules, like a specific date range on to your working inspector.
What is a View?
A View can consist of the following items available in the Preview Inspectors:
- Primary Basis
- Table
- Graph
- Date Selection Range
- Applied Filter
- Sort Order, Additional Basis columns and other options
There are two main types of  Inspector Views:
- Those that replace all of the attributes of an inspector
- Those that replace a subset of the attributes of an inspector
Some Views provide all of the components to make a complete picture of the data selected. While others add in key areas like a common date range lookup or add in additional basis (metric grouping) columns.
Note: Custom is the default view for the Preview Inspectors.It will Clear any current view.
What’s great about these new views is they very quickly give the best output or view of the data you are most interested in. You don’t have to search to find the best graph or best filter available; the view will do it for you.
Replacement Views
These views are also nicely organized by high level groups. For example FIT related views or UX related views.
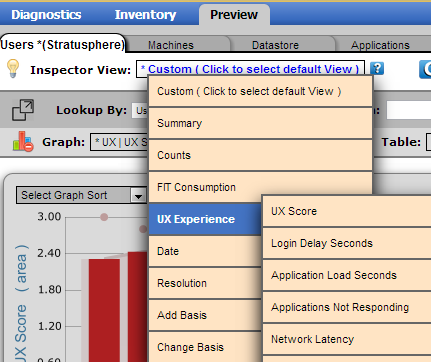
Let’s look closer at the first use of views; they are those providing all of the components of specific use case. They will replace the attributes of the current inspector with best choice attributes for the view use case. Suppose you are interested in a network latency issue that maybe affecting certain user’s User Experience. We have a view for that, select under UX and then Network Latency.
As part of this View it brings in the appropriate graph ‘Network Latency’ as well as sorting the resulting data by the Network Latency column in descending order. Now you can the data returned to pin point which machines and users are having a latency issue.
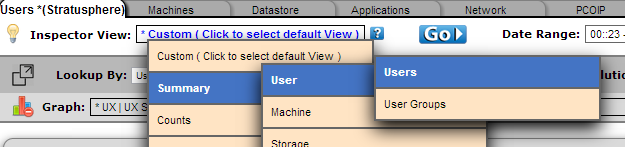
Other views that address common use cases are the summary and counts views. Here you can select views by many different methods including by User, User Groups, Machine Groups and Storage Datastores. They are very effective looks at your data with the best graph and data columns available for your selection. For example if you select Summary -> User -> Users you are provided with the UX Experience score graph.
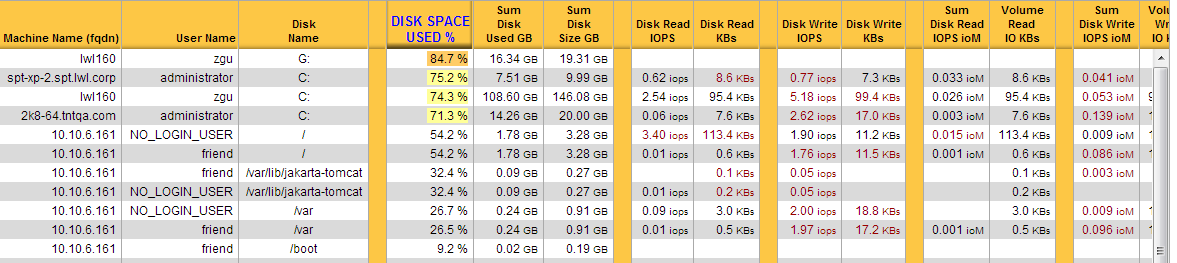
Another interesting Summary View available is looking at Storage Partitions for the Machines and Desktops where data is being collected for Stratusphere.
Subset Views
Next let’s look at the other type of view available. These views add in additional information to or change a subset of your current inspector and data being worked with. Maybe you want to add a preset date range, or add a new basis or sorting column. These views will do that for you.
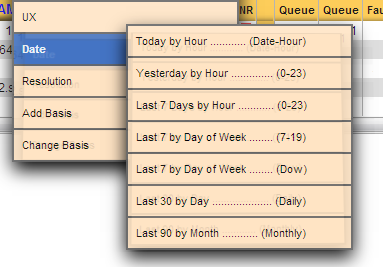
The Date views will add in common date lookups and groupings, like ‘Today by Hour’ or ‘Last 30 by Day’. Or a nice one is specific to only working ours, ‘Last 7 by Day of Week (8:16)’.
In addition you can use Views to add in additional Basis columns to your result data being looked at. A Basis is the primary method of how your group data. If the primary basis is by User then your data will be grouped by User first. Adding additional basis columns bring in more levels of grouping. For example adding the Users, Machines view will then group your data first by users and then by machines. If you select Datastore that will how show the datastore associated with the user or machine and group that as the next column.
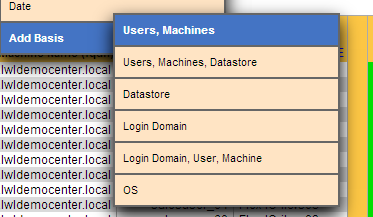
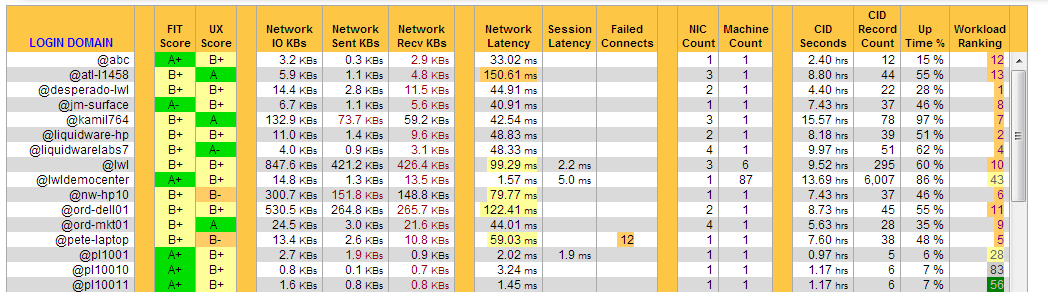
Another example would be to select Login Domains. Here it makes the primary column ( basis ) the Login Domain of the users that have logged in.
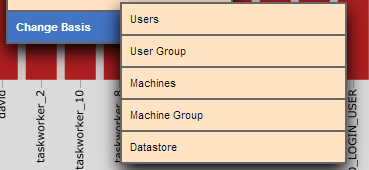
You can use the Change Basis views to quickly change the primary column you are grouping your data on. Everything else would stay the same, for example your selected graph would remain. You could quickly switch from grouping by Machines to Users using the Change Basis -> Users view.
The Resolution views will update how your data is grouped in relation to date and time. For example you can use a resolution of Day of Week and you will see the date grouped by each day of the week, a resolution of Hour will group by hour of the day.
More Information
The new Preview Inspectors Views in Stratusphere UX 5.6 continue to make your job easier and more efficient as you use the power of Stratusphere UX metrics and the Preview Inspectors to monitor, analysis and report on your machines, users and environment.
For more information on Liquidware Labs Stratusphere UX visit the Stratusphere UX Product Page or contact sales at Liquidware Labs.
Pete Del Rey
Technology Evangelist
Liquidware Labs


Leave A Comment
You must be logged in to post a comment.