MICROSOFT POWER BI

Power BI provides you with several analysis tools that give you an overview of your business and an indispensable insight into your data. The ability to create dashboards, interactive reports, and access data while on the move through mobile applications are both easy to use and free! Power BI for Office 365 is Microsoft’s cloud-based BI solution that, together with Excel, delivers a complete self-service BI solution designed to analyze and visualize data from multiple sources.
LIQUIDWARE STATUSPHERE UX

Part of Liquidware’s Adaptive Workspace Management suite, Stratusphere UX is the industry-leading user experience monitoring and diagnostics solution. An independent and platform-agnostic architecture, the solution provides user-centric visibility that is persistent across platform delivery. The ability to examine and drill down into user, machine and application workloads is critically important to optimize the workspace environment and design an Applications Strategy.
In this step by step guide, we’ve described how to extract data from Liquidware Stratusphere UX using Microsoft PowerBI. By doing so you get the best of both worlds which allows you to create reports tailormade to your needs.
To continue with the steps in this blog the following prerequisites apply;
- Stratusphere UX
- Stratusphere API Access
- PowerBI Desktop
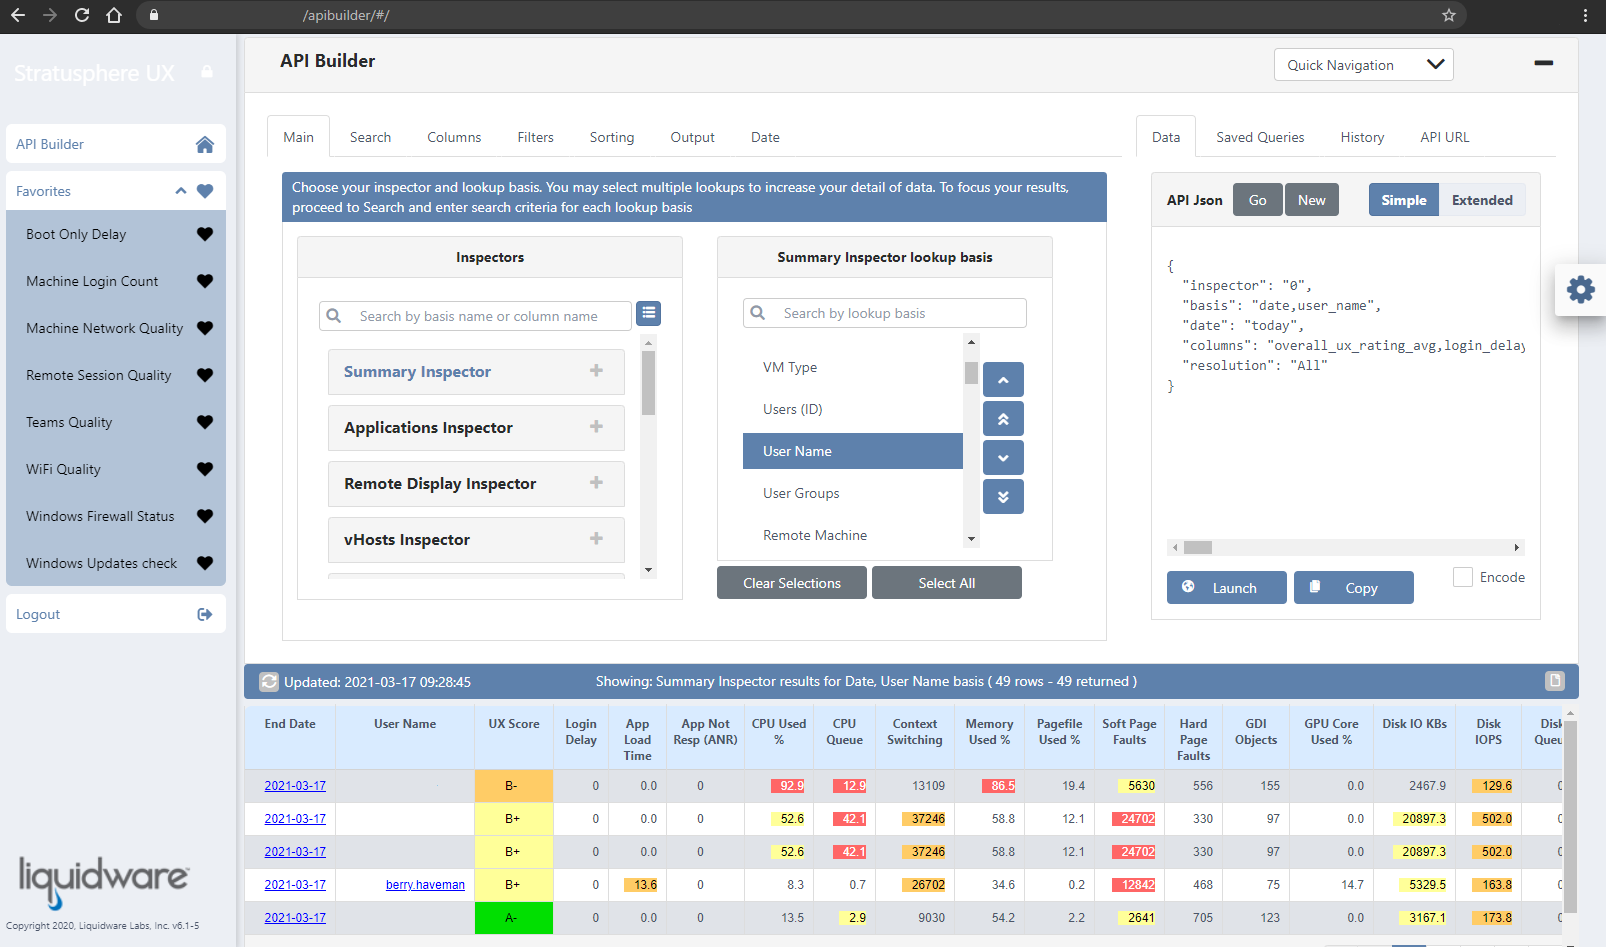
The best place to start with data extraction from Stratusphere is the API builder which is available on every Stratusphere appliance through https://<StratushereHUB_FQDN>/apibuilder/. In the API Builder, you can choose exactly which data you want to extract. For this guide, we will start with some basic information, but the same principles apply to all data in Stratusphere.
After logging in to the API Builder in the Main tab we will select the “Summary Inspector [0]” as our basis for information. To link information from multiple queries in PowerBI with a many to many relation we need to have at least one column with identical information throughout. Linking queries this way is required for PowerBI to filter correctly. I found that Username is the best for this as it’s present in most data available in Stratusphere.
Once the Summary Inspector is selected and Username is flagged as a basis, you’ll see preview data at the bottom of the screen. From the other tabs in the API Builder, you can mold and filter the data as you want it.
For this blog, we’ll keep everything default and only focus on the API URL: value. Even though the API URL changes depending on the selections you make in the API Builder it will not affect the way PowerBI interacts with the result. (More information on how to use the Stratusphere JSON API Technology can be found here; https://<StratusphereHUB_FQDN>/lwl/api)
In my example I have copied this URL:
https://<hub>.liquidware.com/lwl/api?json={“inspector”:”0″,”basis”:”user_name”,”date”:”2 hours”,”limit”:”0″}
Before we continue to Microsoft PowerBI, we need to make sure the user we’ll be using has access to the Stratusphere API. By default, this is not the case and we need to configure Stratusphere to allow API access.
To be granted secure access to the Stratusphere API, a user must be an Administrator of the Stratusphere Web Interface. Access to the API is controlled by the IP address of the client machine and needs to be added to the Stratusphere Configuration before you can use it.
To enable API access:
- Open the Stratusphere Web client by entering the Hub IP or DNS name in a web browser. Login to the Administrative section using your User Name and Password.
- Go to the Hub Administration > Configuration tab and open the Other Settings section. Enter the IP of the machine to be used to run the API using either the API Client IPs or the Whitelist fields. Alternatively, you can enter multiple IP addresses or IP ranges separated by commas.
More information on the Stratuphere UX API can be found in the online guide. https://www.liquidware.com/content/pdf/documents/support/Liquidware-Stratusphere-Getting-Started-API-Guide.pdf
In PowerBI we need to define a new Data Source from which we’ll be gathering data. Select “Web” as connector. This will make sure we do not have any intermediate steps when extracting data from Stratusphere. Everything we do will directly come from the API without local files. If you can’t find the “Web” connector use the search field.
In the next window paste the API URL we copied earlier and press “OK”.

This will take you to the authentication screen.
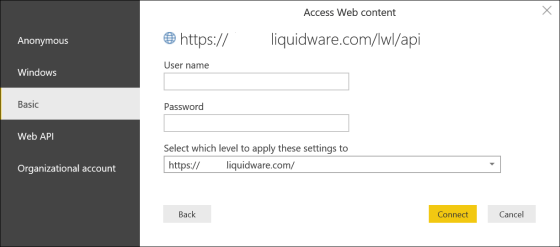
There are different levels of authentication we can use but in this case, we’ll go with “Basic” authentication. Fill in credentials that have the correct privileges and press “CONNECT” to continue.
If everything is done correctly and access through the API configuration is granted you will be presented with the screen below
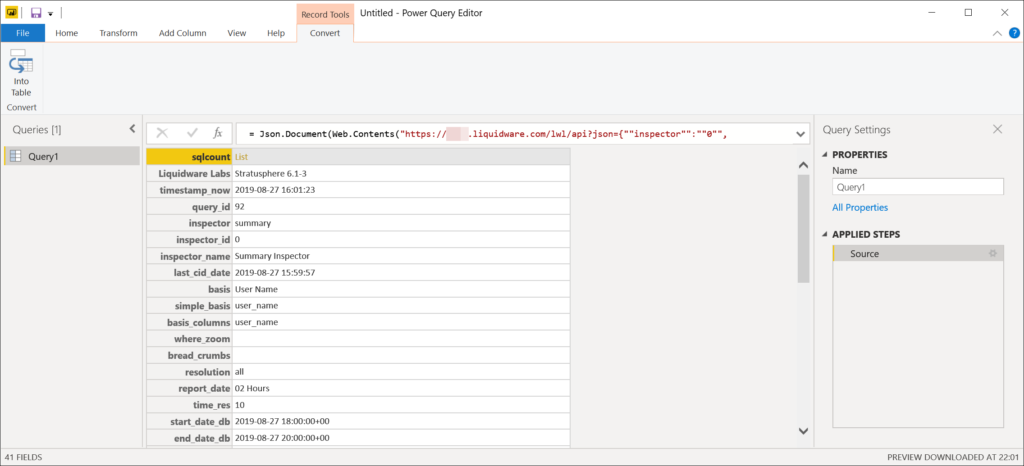
We now have Stratusphere Data in PowerBI. The only thing is, at this point it’s not in the correct format for us to continue.
To get to the actual data we need to scroll down and double click on the orange text “list”. This will bring us to a list of entries that are present in the JSON file. This list needs to be converted into a table and we can do so by clicking on “To Table” in the top right corner.
With the subsequent windows, you can just press “OK”. After this step you still can’t really read the data but have no fear, we are almost there.
At the top of the column, on the right side, you’ll notice a 2-headed arrow. Press that and on the following screen make sure to uncheck the option “Use original column name as prefix” as this will mess up the column names.
Now that this step is complete, there is your data! There is one last thing that needs to be done before we can start to work with the data, and that is to set the Data Type for each column. By right-clicking a column you can edit the data type to the correct one.
While changing columns you’ll notice a cool feature of Microsoft PowerBI, which is that PowerBI tracks every step you’ve performed to get to the results of this query. On the left side if you right-click on Query1 you can choose “Advanced Editor” which shows the PowerQuery code behind the steps you’ve just done.
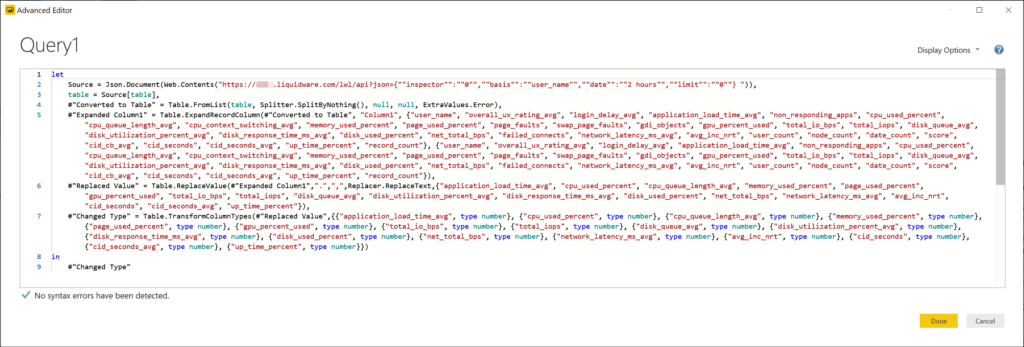
You can then edit these queries manually to extract different data from Stratusphere UX or you can follow the steps we’ve just performed.
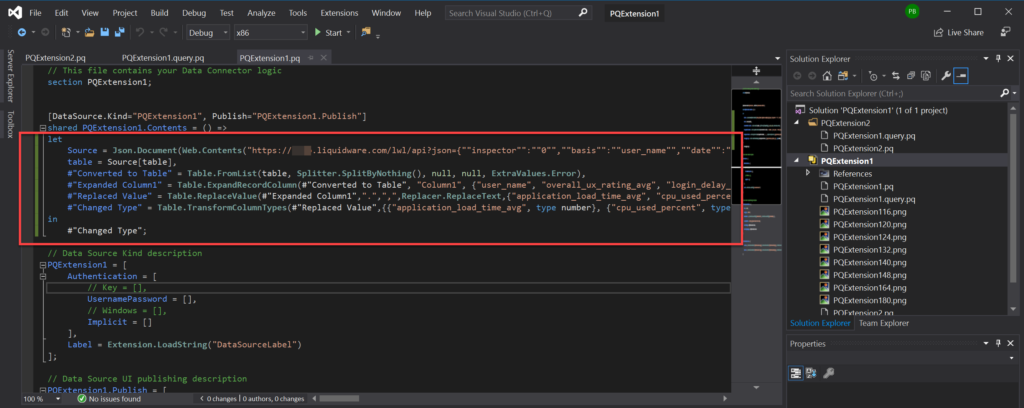
I’ve used PowerBI Desktop in this case but if you want to extract data from a local Stratusphere Appliance and upload it to PowerBI in the Microsoft Azure Cloud you’ll need to place a PowerBI On-Premises Data Gateway on your network. The On-Premises Data Gateway works with Connectors and you can use the PowerQuery code from the Advanced Editor above to build Connectors in Visual studio.
As you can see in the figure below the same line from PowerQuery code in PowerBI are placed in the Data Connector in Visual Studio.
Example Data Connectors are available on https://github.com/microsoft/DataConnectors
Once you’ve extracted and molded the data the way you want it you can “Close & Apply” the query. Microsoft PowerBI will apply the query and the data will become available for you to start building graphs.
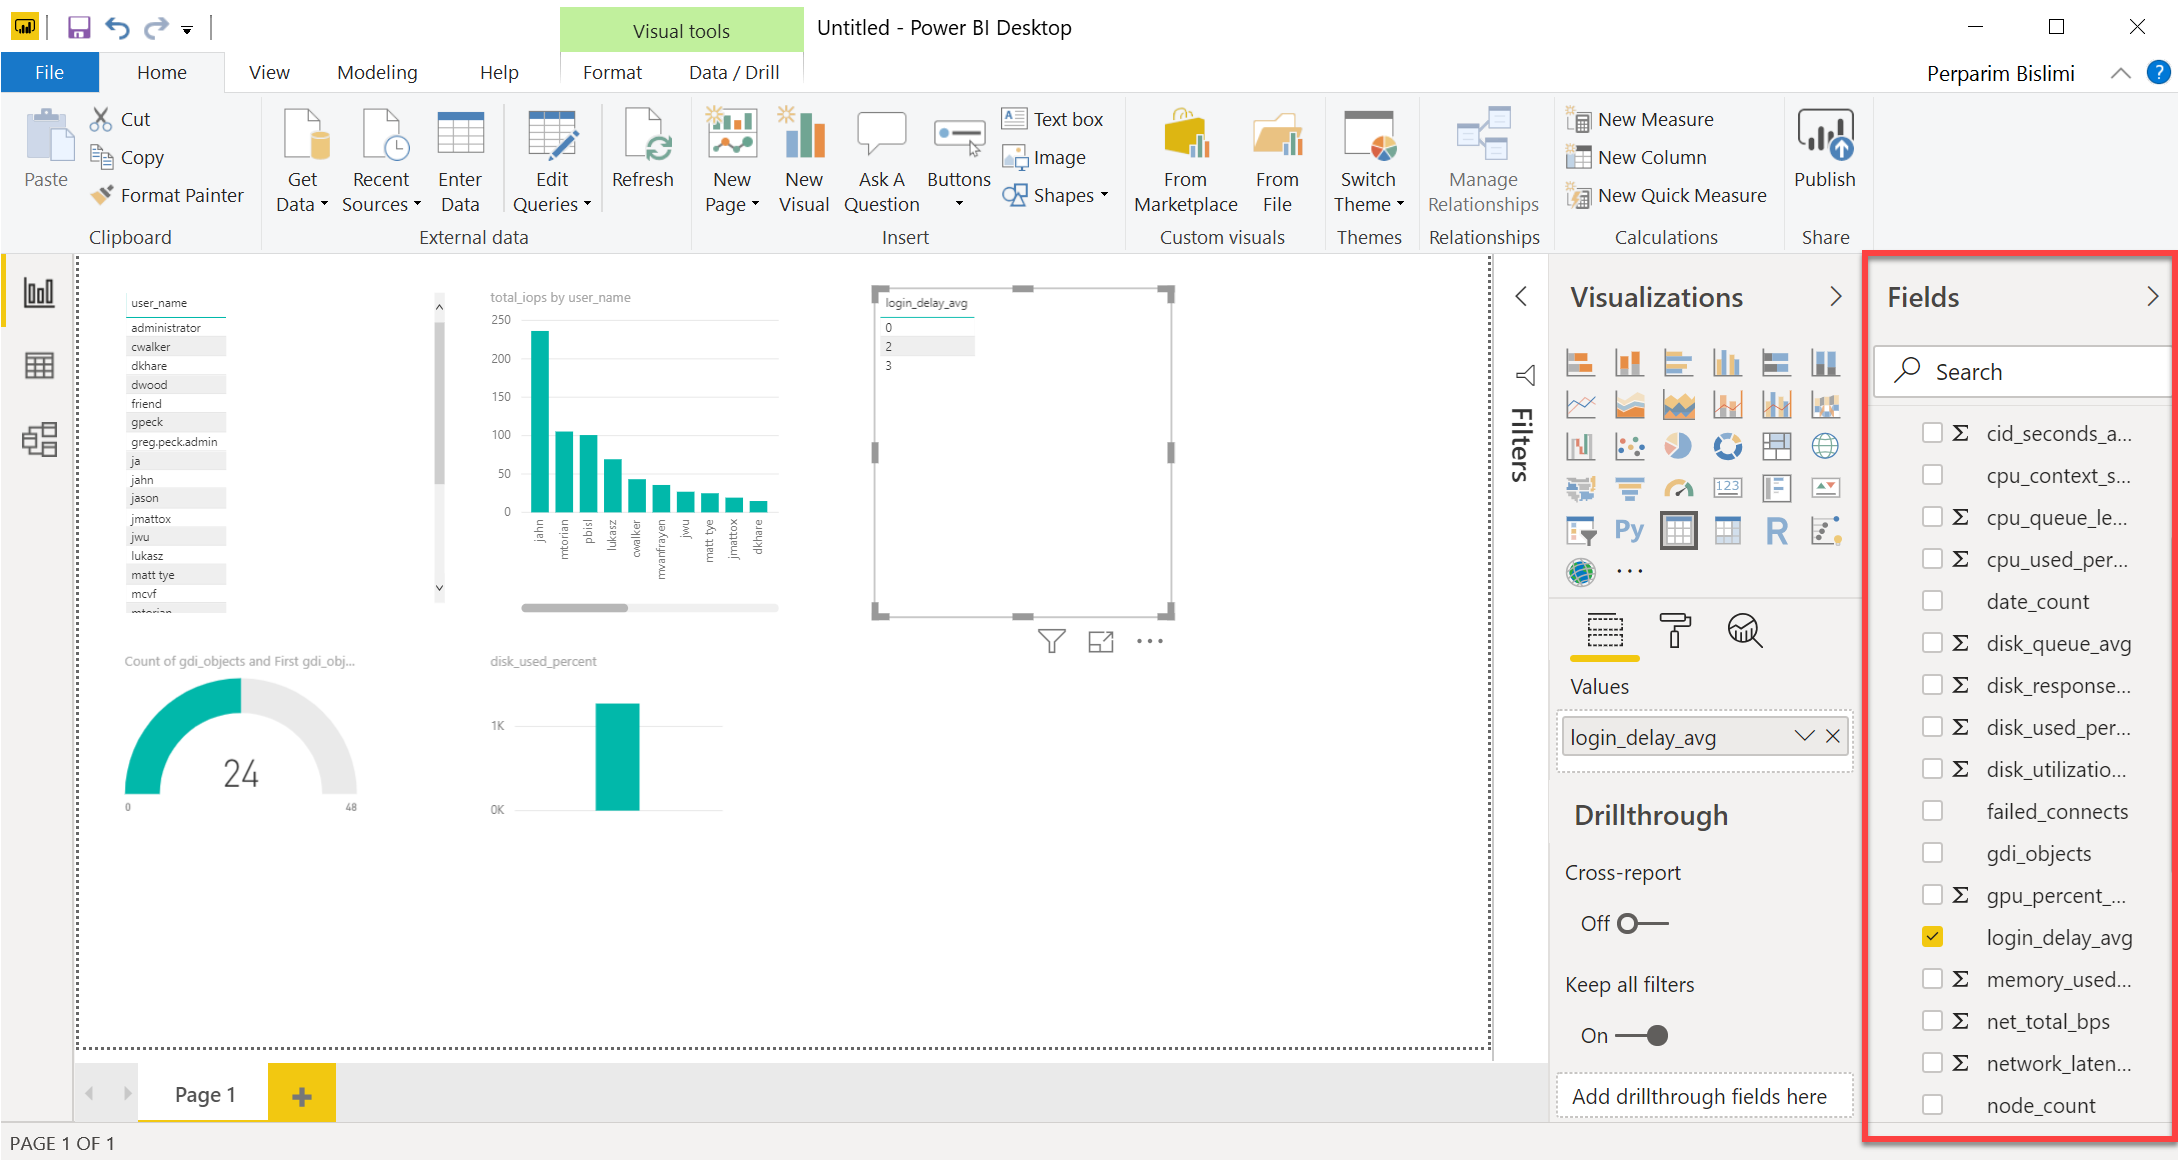
On the right side, you can see the available fields, and you can use those to build all the graphs you want. If you need data from different inspectors from Stratusphere you can create multiple queries the same way, we did before and tie them together with the Relation Manager that PowerBI provides.
Microsoft PowerBI has a lot of great options to present data in numerous ways and Stratusphere UX has a wealth of data about user-facing endpoints which will be more than you’ll ever need. This combination of solutions gives you endless options to present user-centric performance data throughout your organization. Covering all the options you get is a bit too much to incorporate in this blog but hopefully, you’ll be able to get a head start with the information we’ve provided so far.


[…] Stratusphere UX lets you create a custom monitoring dashboard. You can imagine that a helpdesk employee would like a dashboard with the Users UX scores to see how much CPU, RAM, and Pagefile the end-user is using. A system administrator might want a dashboard to see how much CPU and RAM the servers are using. Or better yet, seeing data in the Trends & Top Consumers dashboard. In this way, a system administrator can anticipate the performance needs of the environment. This visibility is all possible with Stratusphere UX. And not only this, you can extract all performance data and add it to your PowerBi dashboards. Click here to learn how to intergrade with PowerBi. […]