In the Stratusphere UX 5.6.4 release you will see a new Overview Tab when you access the Preview Inspectors. This new tab provides the ability to see a number of different Stratusphere UX metric view graphs to give a window into how your desktops and users are performing. Even better this tab is customizable, where you can select a number of different graph groups to zero in specifically to the type of data you are most interested in.
Let’s look closer into the Overview tab.
Overview Tab Intro
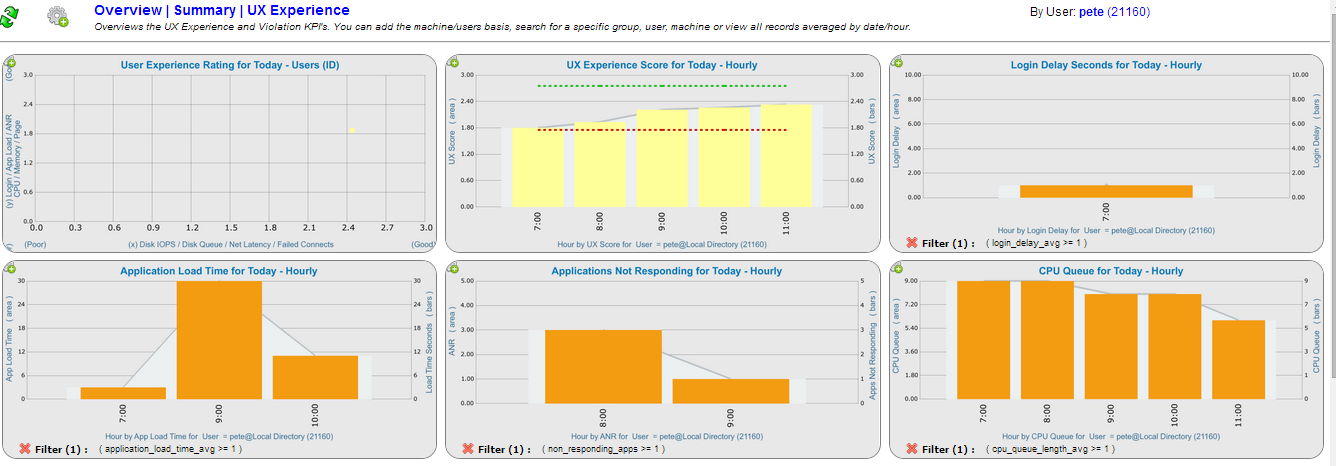
The Preview Inspector Overview Tab provides a number of metric specific graphs to provide a quick and easy overview of your desktop and user environments. Each graph display is very flexible and customizable. It is easy to use. You can do things like add the machine/user basis to change your grouping. Or you can search for a specific group, user or machine. You can also change the resolution to look at different date/time groupings. For example you can view graphs by Day or by Day and Hour.
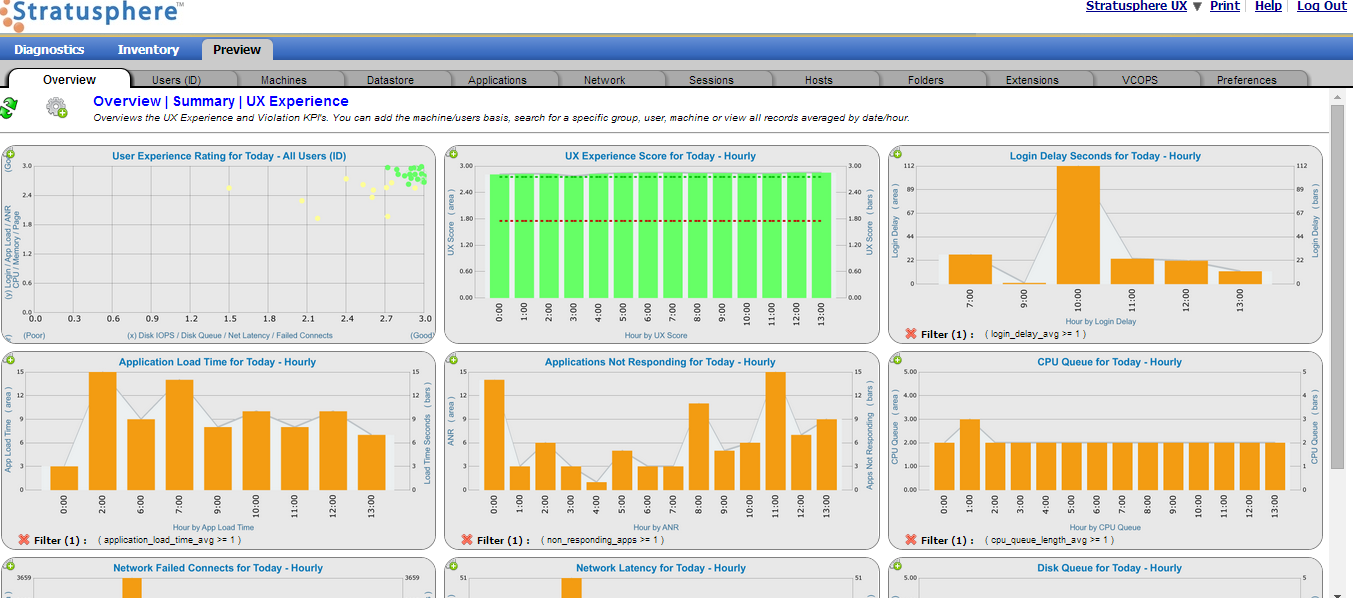
What really makes the Overview Tab very powerful is that there isn’t one set of graphs available, but an entire suite of different graphs that can be viewed from the single Tab. Each graph dashboard has been designed to show specific metrics in a graph format that are important to the overall graph dashboard topic.
Some examples include:
- Overview ->Summary -> UX Experience
- Overview -> Summary -> Memory
- Overview -> Desktop Applications
- Overview -> Sessions
Dashboard Selection
To change the graph dashboad for the Overview Tab simply open the Dashboard Control Widget and select the graph dashboard you are interesting in working with.
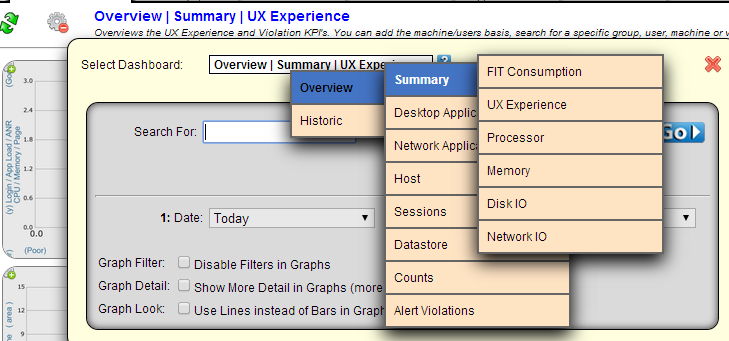
At the top-most level, you’ll notice Overview and Historic dashboard views. The first one, Overview looks at metrics for primarily for the current day. It uses a single resolution for all of the graphs. These are good graphs to choose when you want to look at what is occurring now. The second one is Historic. These graph dashboards use three different resolutions for the various graphs displayed. With different time groupings this gives a very robust look at your data. For example you can see a metric shown over the last day in one graph with the last 7 days shown in a second graph.
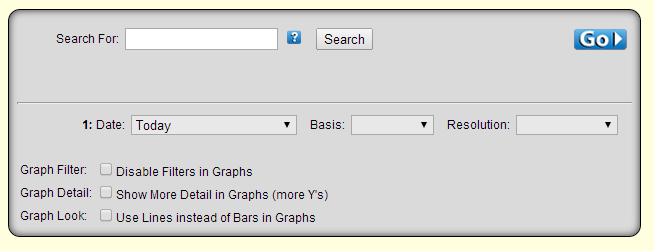
Dashboard Control Widget Options
In addition to being able to select a different dashboard graph, there are additional options available to customize how you work with and view the available graphs on the tab.
At the top-most level, you’ll notice Overview and Historic dashboard views.
The search function is one my favorite ones and can be very powerful. Suppose we are interested in looking at metric graphs for the user ‘Pete’. You can use the search function to help find this data and then graph it which is really cool.
The results show anywhere ‘pete’ as appeared within the metric data the Stratusphere Connector ID (CID) agent has captured. This could be a user, a machine, a user/machine group or even an application. It also shows the last time that particular entry reported data to Stratusphere UX, which is helpful in looking for current information or making sure you have the data you want.
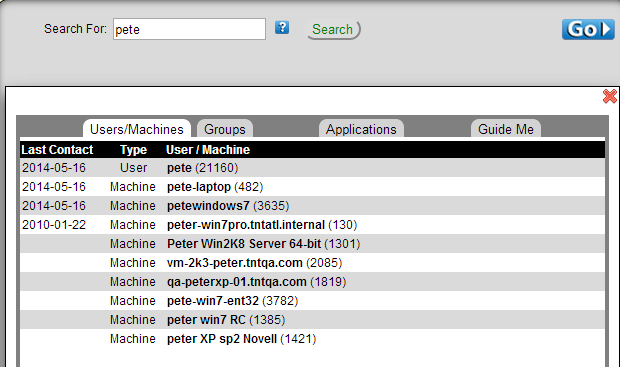
Simply click on your selection and the graph dashboard will be redrawn for the metric data related only to your selection. It is that quick and easy to drill into user, machine or group specific graphs.
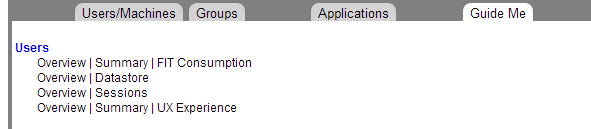
One additional option on the Search page is the Guide Me option. This gives suggestions for graph dashboards that would be applicable to your search selection. If you choose one of the suggestions that graph dashboard will be drawn.
Other options available in the dashboard controls are:
- Date Selection – change your graph window or timeframe
- Basis Selection – change the grouping of your data ( users or machine )
- Resolution Selection – change how you want to see your data, by hour, by day, by hour-day, etc
Graphs and Graph Controls
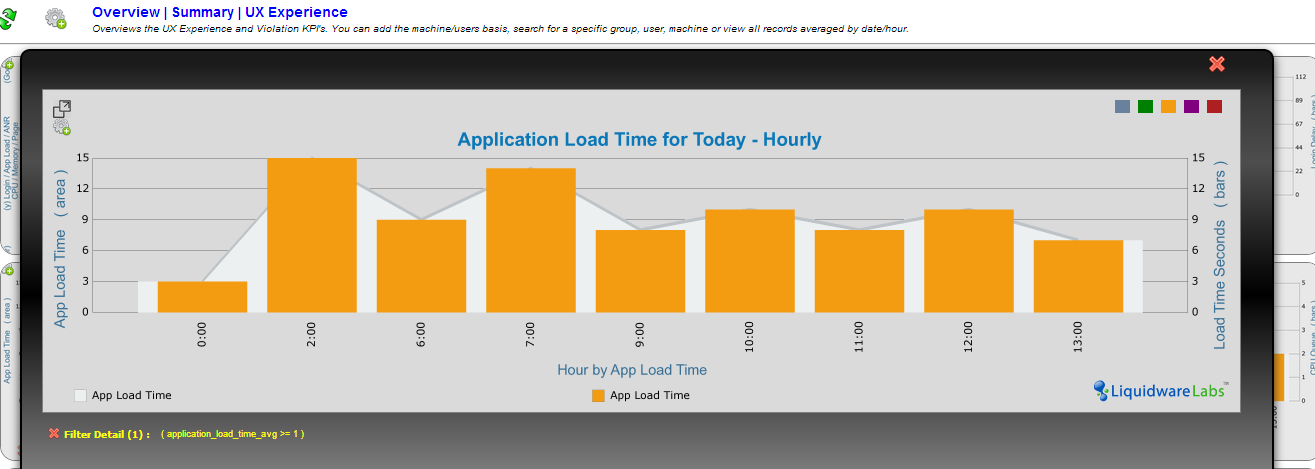
Now let’s look closer at the functionality available in each and every graph within a graph dashboard. Here we have select the ‘Application Load Time for Today’ – Hourly’ graph.
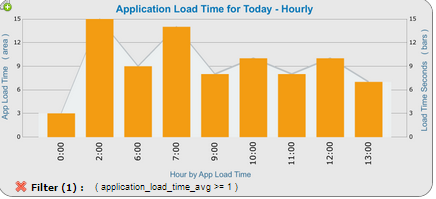
In the top left corner of the graph you will notice a ‘plus sign’ icon. This opens the Graph Controls. Here you have complete flexibility to alter how the graph is displayed, so can view your data exactly how you want to for the chosen graph. A lot of the graph functionality is at your fingertips, which for an IT professional analyzing and working with user and desktop data is a very good thing.
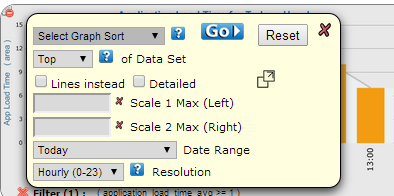
You can do things like:
- Change your sort
- Change your scale for both the X and Y axis
- Change the data range
- Change the resolution
Graph Detail
Sometimes while troubleshooting an issue or just do overall analysis you may want to work closer with a graph outside of it being shown on the overall graph dashboard.
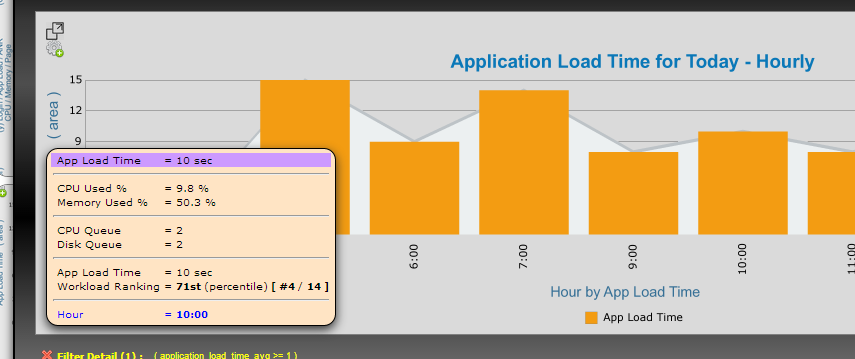
All of the available graphs can be zoomed into by just clicking the graph to view it in full size. You have the same functionality available for graph controls as well as Pop-out inspectors. That is to look at the graph data in the normal inspector table format.
It has also the same graph detail functionality that all Preview Inspector graphs have. If you move your cursor over a graph element it will show a detail window with the exact values for a number of metrics specific to that element. In the below example you can see the Application Load time is 10 seconds and the Workload ranking is the 71st percentile.
Summary
The Overview tab of the Stratusphere UX Preview Inspectors is a great addition to the Preview Inspectors and is a good starting point to get an overall understanding of your environment.
In upcoming Stratusphere UX releases look for more exciting updates to the Overview tabs, graphs and the overall Stratusphere UX Preview Inspectors. All with a goal to provide the exact data you need quickly and easily. But also provide the richness and depth of functionality to properly analysis, troubleshoot or just review your desktop and user metric information.
More Information
For more information on Liquidware Labs Stratusphere UX visit the Stratusphere UX Product Page or contactsales at Liquidware Labs.
Pete Del Rey
Technology Evangelist
Liquidware Labs


Leave A Comment
You must be logged in to post a comment.