Anyone who has been an IT administrator or who has been involved with end-user desktop support has received a call from an end-user saying my desktop is slow, please help. This could be a user in a VDI environment or one with a physical desktop, the request is still the same.
Stratusphere UX captures all of the metrics necessary to analyze and understand your desktop environment and help determine the root cause of these issues. The Preview Inspectors enable you to quickly find the data you need.
So let’s look at this particular use case and see how the Stratusphere UX Preview Inspectors can help solve this problem.
In this example an end-user ‘dgreenspan’ has reported that they had desktop performance issues earlier today. This can be analyzed quickly using the Preview Inspectors in 3 Easy Steps.
1.     Search for the User
First you want to search for the specific user, in this case ‘dgreenspan’ to look at Stratusphere UX metrics captured for them. Three main components used for the search are:
- Users (ID) tab since I am looking for a user
- Selecting the Date Range of Today
- Using ‘dgreenspan’ in the Search field.
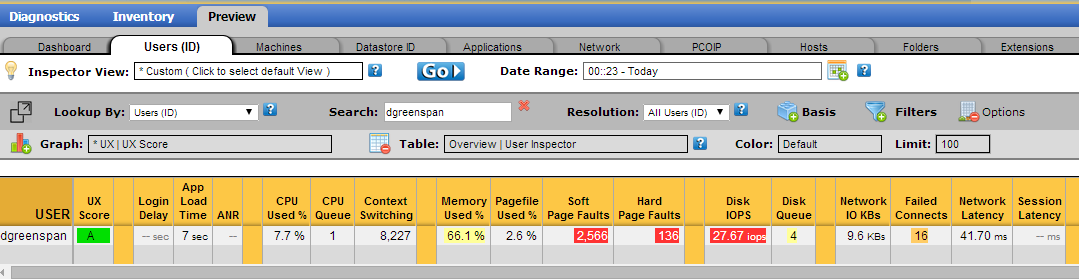
We now see the overall metrics for the user summarized over the entire day and notice a few things immediately highlighted in red and yellow. There looks to be some issues with page faults, Disk IOPs, disk queue and memory usage. We can also see they had an average application load time of 7 seconds.
2.     Drill into the Reported Time Frame
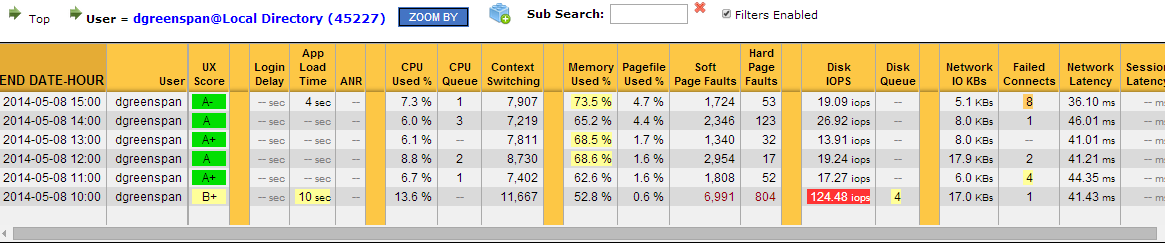
Now that we found the user data for today let’s look closer at what has been occurring throughout the day by drilling into the user for more detail. Simply click on the user name.
This brings you do one of my favorite views of the Preview Inspector. This view uses the Preview Inspector Resolution, ‘Day-Hour’. Now you can see the collected metrics by summarized by hour over the course of the day in question. The user indicated an issue in the morning and we can see immediately potential problems in the 10:00 hour with a 10 second App Load Time and a very high Disk IOPs, highlighted in Red.
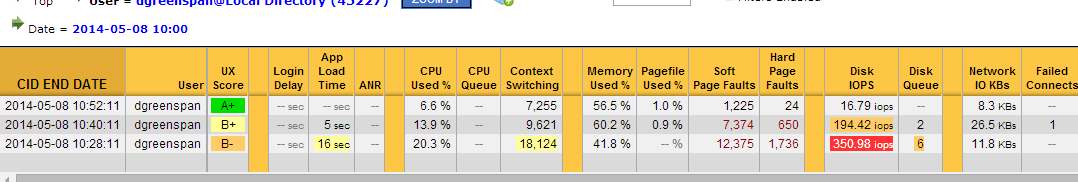
With the Preview Inspectors you can drill into the data even further. You can drill again into a specific hour. In this example the 10:00 hour, that we are interested in we can see the specific Stratusphere Connector ID (CID) records captured during that time. Now we can see the main problem occurred around the 10:28 to 10:40 time frame with page faults, Disk IOPS and memory consumption being the main culprits.
3.     Look at Applications for problem Metrics
We have identified the time frame when the user had performance issues as well as the metrics that were driving that in two easy steps. Now the last step will focus on what applications were running during that time, how were they performing and what metrics drove their performance.
The Stratusphere UX Preview Inspectors have a powerful feature where you click directly on a metric from your results table. This will launch an application specific popup window showing the applications running during that time with the metrics that are relevant to the metric you clicked on.
First let’s click on the ’16 sec’ App Load Time metric to see what applications are driving that high load time.
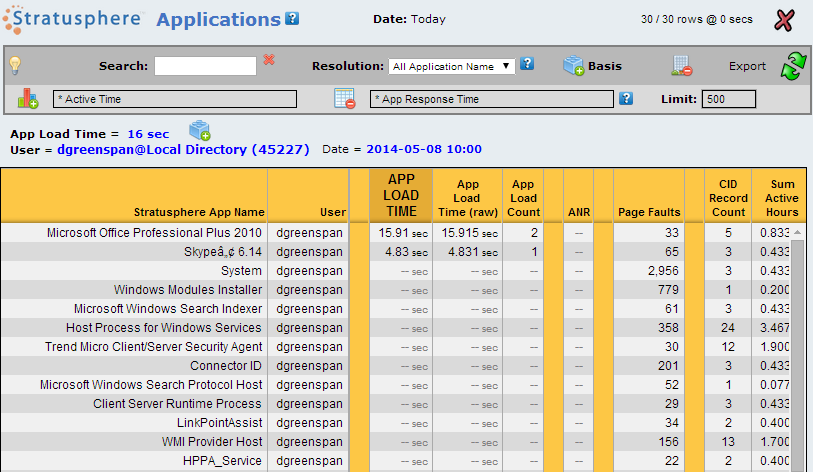
We can see quickly that Office Pro Plus 2010 was the main application being loaded during that time, with Skype being the other.It was Office that loaded in about 16 seconds.
Next lets click on the high Disk IOPS metric that was shown in Red to see what applications are causing the high IOPS.
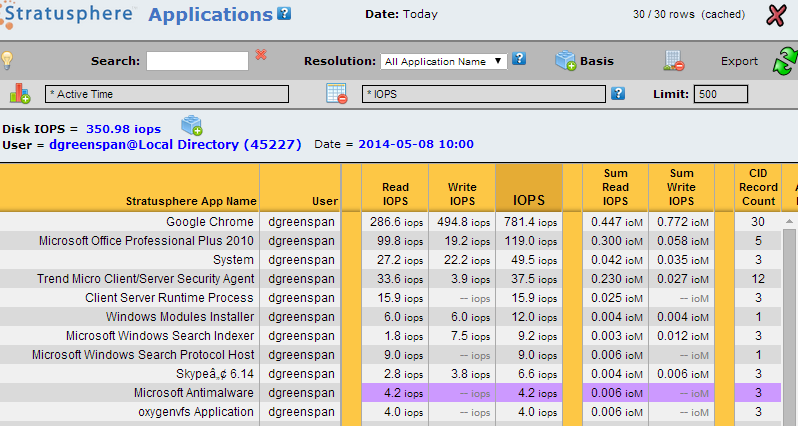
Now a possible issue application has been identified that may have caused a performance issue for the user. We can see Google Chrome was causing a high number of Read and Write IOPs during that time. Maybe it was the webpage the user went to that caused an issue.
Conclusion
We have seen how quickly you can work with and drill into Stratusphere UX data using the Preview Inspectors to solve specific use cases. Here in 3 easy steps we have seen that, yes the end user did have a performance problem this morning. During that time they were showing a high number of page faults, disk IOPS and memory consumption. Looking at the applications running we saw Office 2010 Pro may have taking longer to run then normal and that Google Chrome had a definite issue causing a high amount of Disk IOPS. You now have relevant information that can go back to the end user with to further see what they were doing and help determine resolution steps.
More Information
For more information on Liquidware Labs Stratusphere UX visit the Stratusphere UX Product Page or contact sales at Liquidware Labs.
Pete Del Rey
Technology Evangelist
Liquidware Labs


Leave A Comment
You must be logged in to post a comment.