6.    Metric Specific Application Popups Â
One of my favorites features of the Preview Inspectors are the Metric Specific Application Popups. This provides the ability to drill deeper into the applications running for a specific user concerning a specific metric. If a metric has Application Popups available you will see a ‘Pop Out Apps’ tooltip.

This can be really beneficial in troubleshooting a user issue or just further understanding what is running on your user’s desktop in relation to the metric values shown. For example if you are looking at your users for today and notice for one user they had a high memory utilization during some time periods.
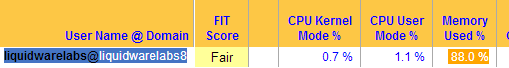
To see what applications are running during that time it is as easy as clicking on the Memory Used % metric. It will then open a new window (a popup) showing the applications running for that user during the time frame originally selected.
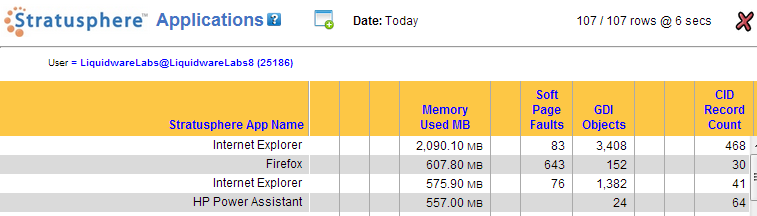
Even better it will show data for the applications specific to the metric you clicked and sort them by the key metric. In the above example that was for memory usage you will notice the sort is by ‘Memory Used MB’ and the top application for memory usage is ‘Internet Explorer’.
7.    Flexible Date Selections
Many times when you are analyzing data you are interested in a specific period of time. With the preview inspectors it offers a lot of functionality to quickly find your data. This includes a number of prebuild date ranges to the ability to setup and save custom date ranges.
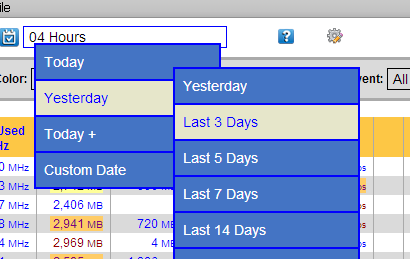
The main groupings are ‘Today’ which shows data captured for the current day as well as options for various time intervals ( last hour, 2 hours, 4 hours etc ). The ‘Yesterday’ groupings have ranges for searching for data in the past over a set amount of days. That could be the day prior ( Yesterday ) or the last 3 days, last 5 days, etc.
A very cool grouping is the ‘Today +’ group which enables looking at the current days data plus the past 2 or 3 days. Lastly ‘Custom Date’ contains various custom date ranges you have set up. You define a custom date range using the icon
8.    Context Sensitive Help
The preview inspectors provide a large amount of functionality and data which is really nice. But with that come various options and selections so providing as much Help as possible becomes key.
In this new technology it is providing more Context Sensitive help to give you the information you need for the field or function you are working with. Throughout the preview inspectors you will see a number of blue question marks or help icons.
![]()
These will bring up specific to the area, view or function near that help icon. For example clicking the icon when you are looking at the ‘Stratusphere FIT/UX Metrics’ view will provide help explaining all the various metrics presenting in that view.
9.    Metric Tooltips
With Color Profiles it makes it very easy to identify metrics that may need further investigation. With Metric Tooltips this is taken a step further to provide quick, additional information about each piece of metric data returned simply by hovering your cursor over that metric.
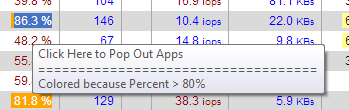
Suppose you had a user whose memory usage was showing as Orange as indicated in the below example. By opening the tooltip you can see what triggered that action and color profile.
In this case the memory percentage was over 80% which triggered the profile to be applied and in this case the metric cell was colored Orange.
Detailed Tooltip Data
The Metric Tooltips also provide additional detailed data regarding some of the metrics. Some of those include Disk IOPS and Network IO.

In the above example when looking at the Disk IOPS metric the Tooltip shows the breakdown of the Read and Wrote IOPS as well as providing additional Peak Metric numbers. Peak1 is defined as the average of the records that are above the overall average. Peak2 is defined as the average of the records that are above one standard deviation. The count shows how many records that are in each Peak calculations out of the overall total.
10.     Export Function
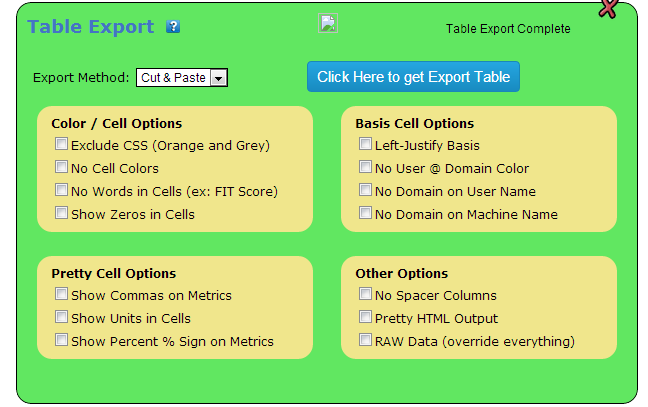
The Preview inspectors have the ability to Export its resulting data into a format that can be pasted in excel. This is currently done through an Export Method defined as ‘Cut & Paste’. In the future additional export methods are planned to be added.
One nice thing is there are many different options available on how you want to export your data. This gives you a lot of flexibility in how you want your data to show. When you click the Export option then click ‘Show Options’ if you want to customize the formatting.
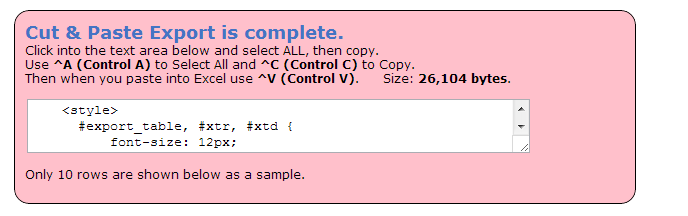
To export the data just put your cursor inside the format box as shown below. Then perform a simple copy/paste operation, as the instructions indicate. Select all the data ‘Control-A’, Copy the data ‘Control-C’ and then on the Excel side copy the data to the workbook ‘Control-V’.
Summary
The 10 cool things about the new preview inspectors in Liquidware Labs Stratusphere is just the beginning of the types of functionality planned with this new technology within Stratusphere. We are always looking at ways to enhance your user experience with Stratusphere, providing better ways to search, analyze and work easily with the vast amount of metrics captured for your data.
Pete Del Rey
Technology Evangelist
Liquidware Labs
www.liquidwarelabs.com


Leave A Comment
You must be logged in to post a comment.