Today many organizations are focused on providing Work from Home options to their employees. But this can be very challenging due to the sheer number of delivery alternatives. Companies can choose from several approaches when they deploy Work From Home programs.  They can supply corporate-owned fat clients. They may opt to provide zero or thin clients. Or they may need to rely on their workers’ personal devices. Workspaces can be in on-premises datacenters or in the cloud.
The Key To Success – End-to-End Metrics Data Supports Planning & Design
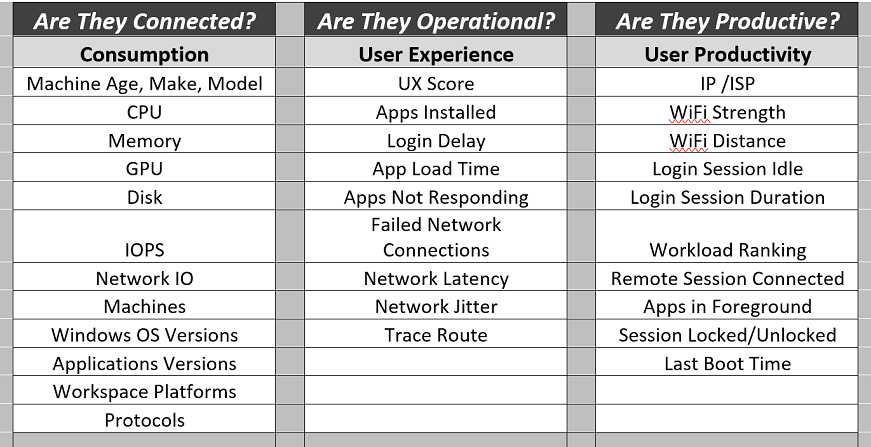
The secret to success for these programs is to be sure that you’ve answered three key questions. First, are your workers connected? That is, do they have the basic technologies that they need to perform their jobs remotely?  Second, are workers operational? Meaning can they login quickly? Are their apps responsive?  Are their network connections free from latency and jitter?  And finally, are they being productive? Are workers active on their workspaces and getting their jobs done?
With the launch of version 6.1.5 this week, Liquidware Stratusphere UX has added critical “First Mile” metrics and now provides a comprehensive view of the data you need to ensure a quality work from home option to your employees. Regardless of how you deploy workspaces, Stratusphere UX lets you home in on the specific data tied to your delivery option and answer the following questions.
Are Your Workers Connected?
Stratusphere UX supplies three categories of metrics to evaluate work from home programs. The first, that we call consumption metrics, helps answer the question “are your workers connected?” These are essentially “inventory” kind of metrics that describe the resources that you currently or plan to deploy – including, (but not limited to):
- hardware devices, operating systems, and application versions
- CPU, memory, disk, GPU
- Platform data for Amazon Workspaces, Citrix, VMware, or Microsoft WVD.
- Cloud data
Are Your Workers Operational?
The second category is User Experience metrics that show if your workers are fully “operational.”  These metrics reflect the behavior of the workspace, and examples are UX score, Login Delay, App Load Time, Apps Not Responding, and so on. They help you determine whether workspaces are performing as required or if potential issues are cropping up.
Are Your Workers Productive?
Finally, Stratusphere UX provides User Productivity metrics that confirm that workers are spending their time actively engaged on workspaces. These metrics include such things as Wi-Fi strength and distance, the duration of user sessions and what apps are actively being used.
Below is a table showing a sample of Work From Home Metrics in each of the categories.
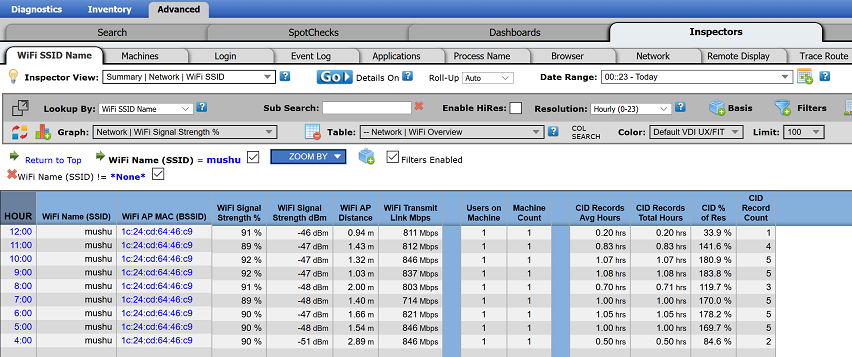
You can find detail Work from Home data in the Advanced Inspectors. Here is Wi-Fi Strength and Distance data.
Or you can collect the data you need into one or more SpotChecks. You can choose from more than 180 individual metrics to group a subset of WFH data into a single view that you can revisit and hone regularly.
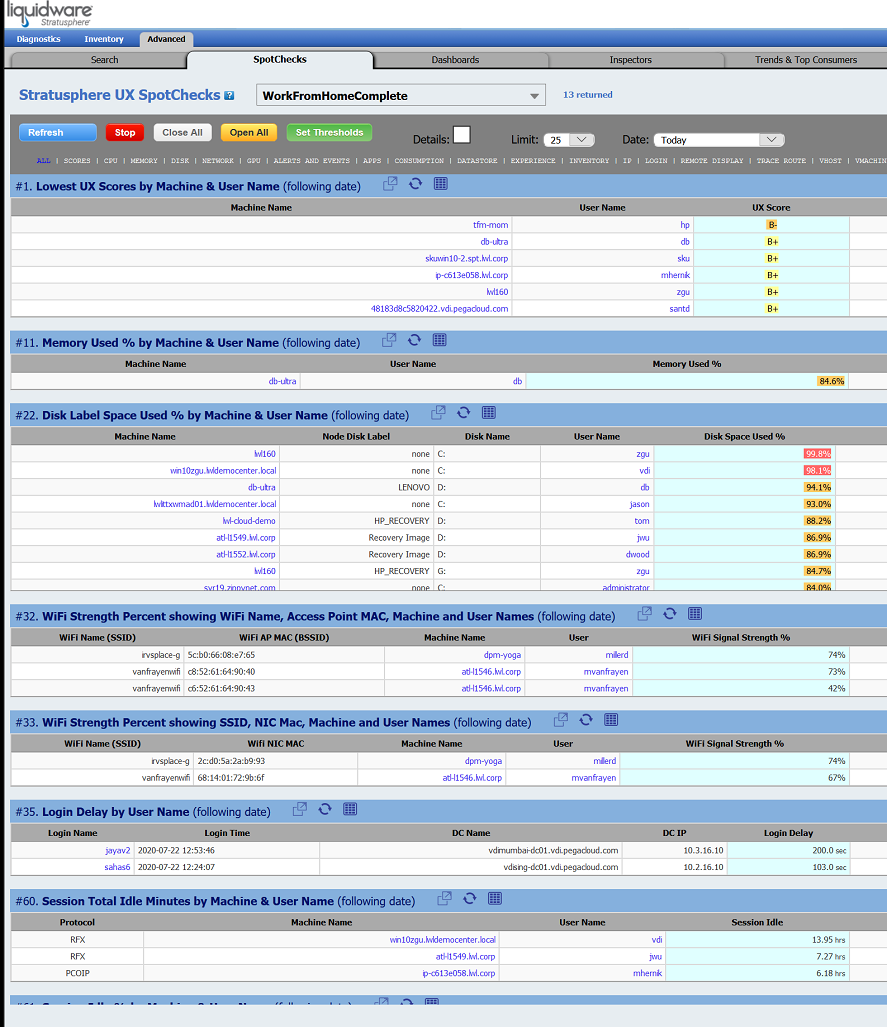
We have a great training video that can show you how to use this function, Understanding Advanced Mode SpotChecks.
If you would like more information about how Stratusphere UX 6.1.5 can help you plan, launch and monitor the performance of your Work From Home programs, you can visit our Stratusphere UX WFH page that has more information about the practical steps you can take to move forward.
If you would like to talk to someone today about this, please contact sales@liquidware.com or info@liquidware.com.






Leave A Comment
You must be logged in to post a comment.