I’m often asked if Stratusphere UX offers real-time metrics and information about the user experience. It’s a good question, for sure. Who doesn’t need the ability to visualize end user workspace issues and get to the root cause quickly. That said, I would ask that you not associate immediacy as an important variable in the ability to determine root cause.

Consider this. In all the trouble ticket instances you have witnessed, have you ever seen an end user computing issue that only occurs at the exact instance the helpdesk phone rings? In fact, it’s just the opposite. Right? We’ve all encountered “technician syndrome,” where a computing issue magically disappears as soon as the complainant initiates a call to the helpdesk.
Joking aside, computing issues are most often characterized in the following few ways: the slow burn that smolders under the radar for some time; eventually creating enough pain for the user to call in. There is the catastrophic event, which generates a more immediate pain for the user. Last and certainly not least, the elusive “it doesn’t do it all the time” complaint that seems to come and go without reason.
In all three of these cases, the root cause of the issue is not dependent on you getting a look at the environment in real time. In fact, there are instances when ‘real-time’ won’t provide any visibility. In all these cases, the event took place prior to your notification—real-time might show you an event that is still in process, but it will not show you the root event or the trend that finally tipped the scales and created a helpdesk moment. These things happened prior to the call.
The Real-Time Crutch
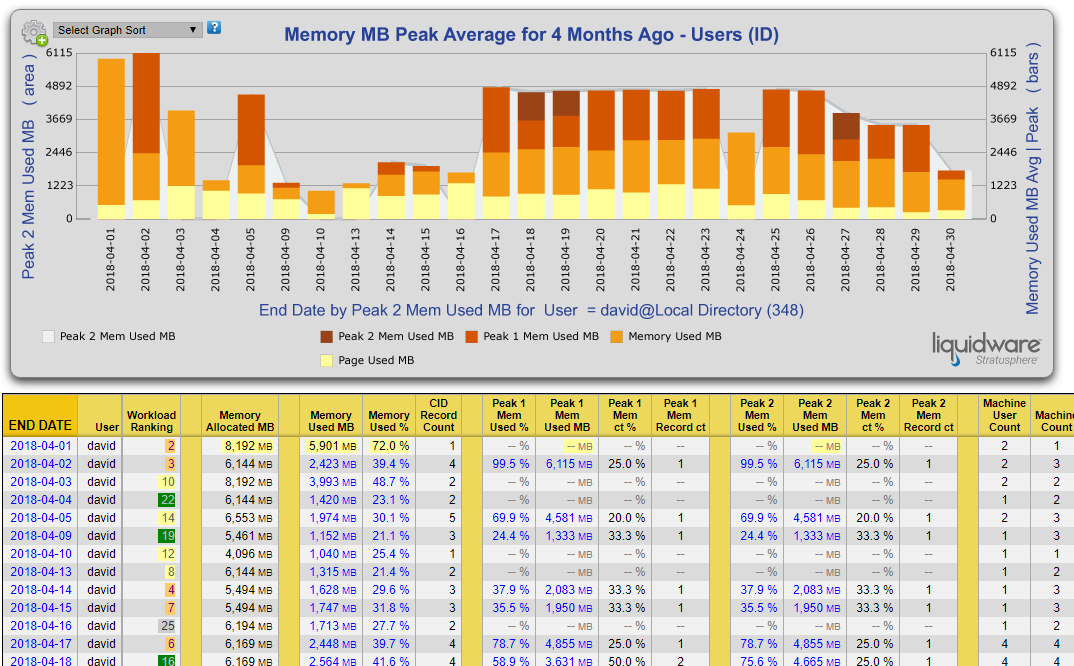
I would make the case that real-time is a crutch or cover up for tools that are unable to show you breadth, depth, and historic detail of metrics and information. Have you ever asked a user to phone back if the problem happens again—as you are not seeing anything relevant in ‘real-time.’ Or perhaps the complainant ‘thinks’ the issue started last Tuesday, but they’re not sure. For example, what if you wanted to see memory consumption for a specific user four months ago—the user ‘thinks’ something changed at that time and is just getting around to phoning you now. Stratusphere UX provides the ability to select date ranges that will suite your unique use cases.

Most low-level monitoring tools provide immediacy to lull you into a false sense of security. The illusion of real-time data looks interesting and creates a feeling of comfort. It makes you believe you’ll be able to diagnose and resolve issues quickly. Those who have lived in the world of end-user computing architectures understand the difference between seeing what is happening now has no relevance to your ability to see the trend, root issue or how widespread the issue may be. Of course, you can wait and hope that the trend will surface from the present timeline moving forward. But the ability to see back in time is often completely missing from these rudimentary tools.
Three Dimensions of Visibility
Beyond the need to see this level of detail from a historic and trending perspective, is the need to gain visibility in the third dimension represented by the many-to-many problem. What about the other users on the same VDI pod, or those who might be using the same XenApp-hosted application. Are you able to gain visibility to all of your users and all of your applications; starting last Tuesday?
The need to capture information for all your users, all your machines and all applications—all of the time—is necessary for a complete view of your environment. Being able to diagnose the complexities of shared infrastructure, the interdependency of resources in host-based workspaces, and the troubleshooting skillset associated with machine boot and login performance can be challenging on their own. Having to accomplish this in the context of many-to-many is an impossibility without the right solution.
Enter Stratusphere UX
I recently posted about the Stratusphere UX Profile Score, and how it creates a defined and quantifiable composite metric that leverages industry best practices (minimizing CPU queuing, failed connections and non-responsive applications, for example) as well as other variable indicators (login delay, application load time and latencies, for example). A user-centric measure that can be used both to define success as well as to identify performance that may be trending away from an acceptable user experience is important.
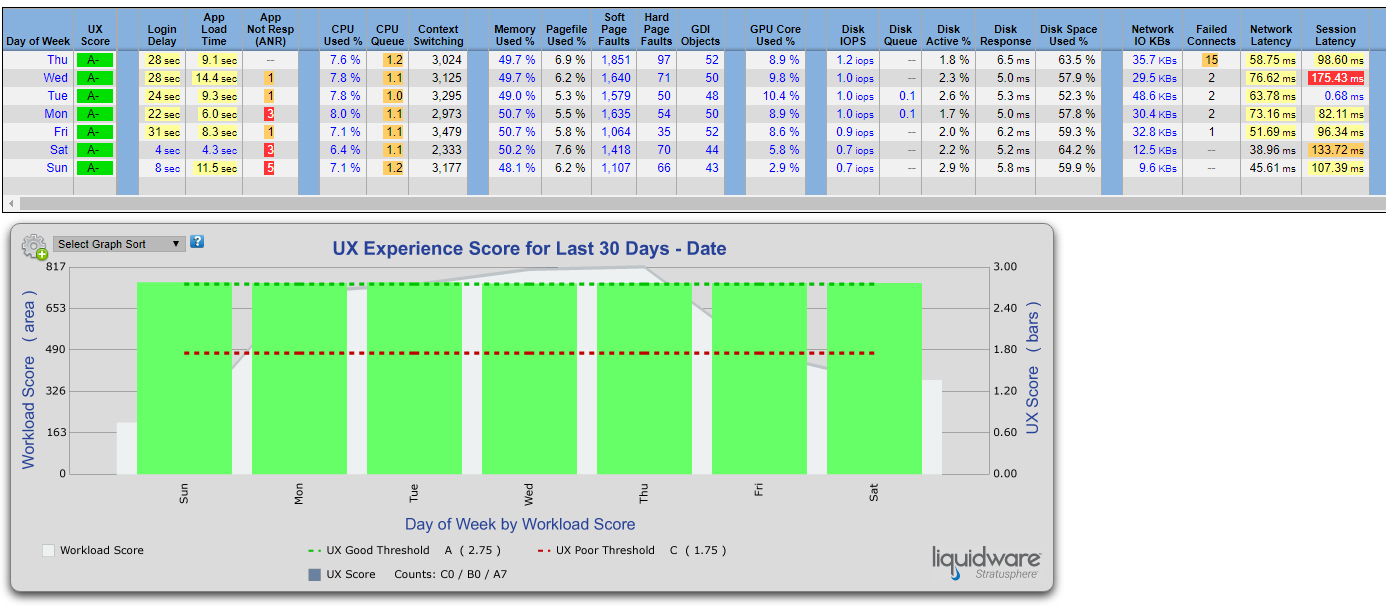
The critical take away, however, is Stratusphere UX’s ability to not only provide visibility to a specific user at a single pint in time, but to also provide many-to-many visibility in aggregate. For example, what if you wanted to see the user experience for your VMware users over the last month, aggregated by day of the week. Stratusphere UX allows you to filter and sort on all of our metrics to focus on those details that help you to identify the trends.

This is the pièce de résistance as it relates to the many-to-many visibility challenge. Having detailed metrics and information on all of your users, all of your machines and applications—all of the time—is what sets Stratusphere UX apart. Real-time is interesting, but I would contend the reality of real-time is that it’s a crutch. It’s an attempt to put you at ease. Instead of blindly leaning on this feature, take the opportunity to explore what metrics and information you are not seeing. More specifically, ‘when’ are you not seeing it.
This critical differentiator should be at the top of your list if diagnostics is important to you. Not monitoring, but diagnostics. Remember it is not a matter of if you will need to troubleshoot; it is a matter of when. Be prepared. I’d love to hear about your diagnostic blind spots and how you’ve prepared your organization to minimize risk in the delivery of end-user workspaces. Write me and share your end user challenges as it relates to meeting expectations and quickly getting to the root cause of challenging issues.


[…] previous posts I’ve written about real time visibility, and whether it’s a necessity or red herring. I’ve also written about quantifying the user […]