10 Cool Things about the New Stratusphere Preview Inspectors
With the Stratusphere 5.2.1 release Liquidware Labs is introducing a preview of new Data Analyzing technology which we are very excited.
This new Tab in Stratusphere provides a Preview of new technology being developed, which provide faster and more flexible methods to view and analyze your data. Included are purpose built views, drill downs and optimized queries for data selection. It is the intention of the new technology preview to enhance your ability to better understand future Stratusphere direction and how it relates to your environment and use cases.
Let’s look at the some cool aspects of this new technology which we believe will enhance your user experience in working with Stratusphere data and provide you with more flexibility and power when working with your data and understanding its impact in your environment.
1.    Multiple Level Data Drill Downs
One of the coolest things in the preview inspectors is the ease and flexibility there is in getting quick access to the data you want. Within every View you can continue to drill deeper into the record specifics or change your groupings.
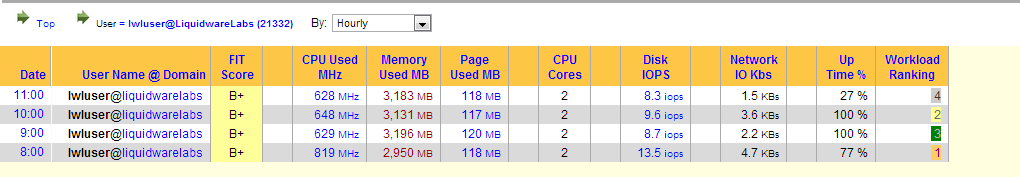
For example if you are looking at a specific user for a single day but want to see their metrics in more detail.
![]()
You can drill into simply by clicking the user and you are presented with their data for the data grouped by Hour. Changing options in the ‘By’ drop down box you ‘Day of Week, ‘User Group’, ‘Machine’ and others.
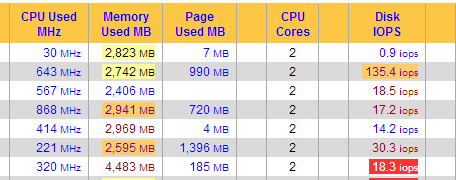
Drilling in deeper into a single hour you can then see the lowest level of metric data and that is the specific Inspection reports sent to Stratusphere.
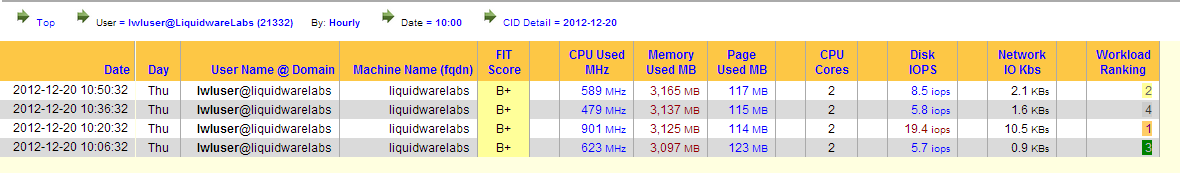
The arrow icons on that top also offer a really nice functionality. Clicking on any of those arrows returns to you to the view specific to that arrow no matter how deep you are in the drill downs. For example, to return to the view by the lwluser as shown below click the arrow by it.
![]()
2. Â Â Metric Specific Views
Another cool aspect of the preview inspectors is the many Metric specific Views. A view being a logical grouping of metrics specific to the type of data you are looking for. For example if you are looking for metrics that are part of the User Experience, you would use the ‘User Experience’ view under the UX Overview section.
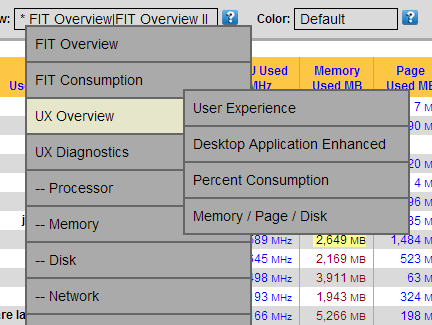
It would then show metrics they have been identified as key components of a ‘Users Experience’

Other cool views are resource specific views. If you are looking for all metrics concerning memory or network then choose views from those sections to focus on just those metrics. This is makes it very easy to zero in on the metrics that are important and critical for whatever analysis you are doing or issue you are trying to resolve.
3.    User Preferences
In addition to analyzing the user experience of your user install base we also wanted to enhance the user experience of using the Stratusphere application. Through preferences we now give ability for a user to customize some aspects of the user interface. Â For example if you don’t want to use colors you can turn them off. Or if you prefer a different font size you can change that to. How cool is that.
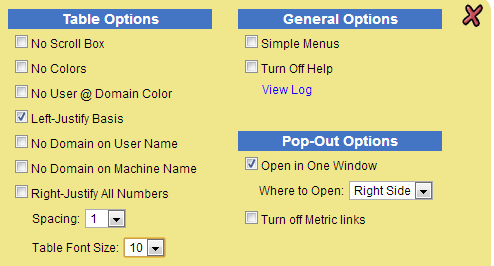
In the initial Preview version of the inspectors these preferences are for the current session only but in the future we plan to look at saving them per user login.
4.    Color Profiles
When analyzing metric data you want to be able to quickly identify where the issues or problems are as well as what areas are functioning well.
In Stratusphere we have always done this with colors, green being good, red being poor etc. With the preview inspectors we have taken this a step further and have introduced Color Profiles. This brings your data alive and makes it easy to directly focus in on problem or other areas of interest.
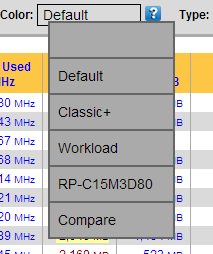
We have pre-configured a number of different specific color profiles based on various methods of indicating a metric status.
5.    All About Applications
One of the really nice things Stratusphere Connector IDs do is gather lots of data specific to the various applications your users are running. From things like to ‘Application Load Time’ to ‘CPU Used’ and ‘Graphic Device Objects’. It is all there.
Understand problem and good performing applications within your user community is definitely. It is ‘All About the Applications’ usually with your users.
With the Preview Inspectors we are providing more ways to quickly understand how your applications are performing and the ability to drill into them in various ways to quick and flexibale access to your data.
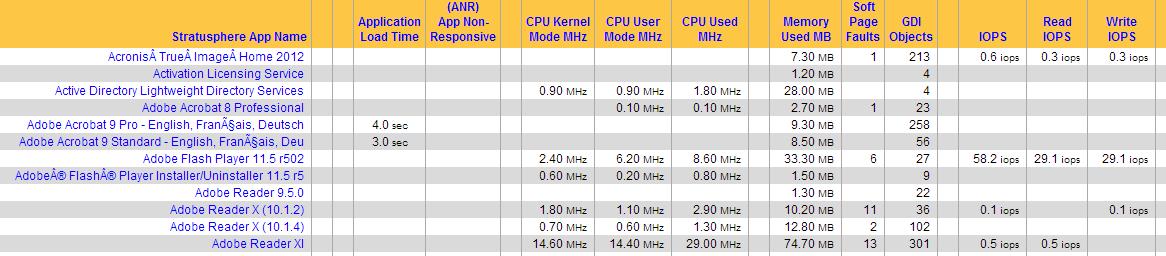
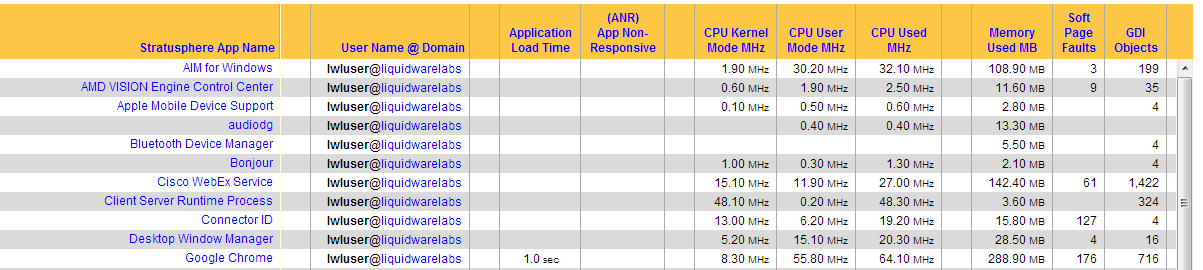
Let’s say you are looking for how Chrome is performing for today for all your users. Select the Applications Inspector and search for Chrome.

Now you want to look at specific users running Chrome today. No problem, just click into ‘Google Chrome’ to show your users.
![]()
Application Basis:
Now lets look at Application Basis which is even cooler. Suppose you want to see what applications are running for a specific user. With the preview inspectors it is very easy. Open the menu under ‘App Basis’ and select by Users.
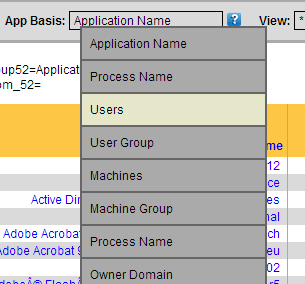
Now you are looking at your application performance grouped by your Users, very cool. Notice you group by many other different selections including Process Name, Machines, User Groups and more.
Now we click into our user in question. For this example ‘lwluser’ and we now see all the applications being run by that user and their associated captured metrics. All within a few fast clicks, awesome.
Pete Del Rey
Technology Evangelist
Liquidware Labs
www.liquidwarelabs.com


Leave A Comment
You must be logged in to post a comment.