

Stratusphere UX 5.5 Preview Inspectors Updates
With the release of Stratusphere 5.5 we have implemented a number of important changes to the UX Preview Inspectors. These changes are designed to provide a faster and improved user experience, as well as provide additional functionality and deliver much more robust data. The goal being to provide an interface where you can easily and quickly find the all the data you need regarding your environment. This will enable you to better understand what is occurring and what metrics influence your users and desktops.
I wanted to review some of the key enhancements made in the 5.5 Stratusphere UX release for the Preview Inspectors, what they are and why they are important.
Tab Approach
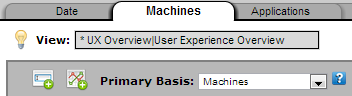
The first thing you will notice in the new release is the Preview Inspectors layout has been redesigned to a tab based approach. Each of the inspectors available are shown across the tabs as well as your User Preferences. I

The first two tabs (Date and Users) are based on the Stratusphere Connector ID (CID) summary report information. That is the summarized metric data collected from your desktops. Each shows similar data just summarized differently, for example by Date or by User. These are very good tabs to start with when doing analysis of your environment.
Note: When on either the Date or Users tab if you change the Primary Basis it will show that Basis name in the tab header. For example if you select the ‘Machines’ Primary Basis the tab title will now say ‘Machines’.
Primary Basis
The next aspect of the inspectors you may notice is when you are working on any of the Preview Inspector tabs is the Primary Basis drop down box. This is the main method of how your data is grouped within the inspector. It usually will be the first column of your result table.
Primary Basis options are all of the most logical ways you would want to view and summarize your data. Some examples are:
- Date
- Machines
- User Name
- Login Name
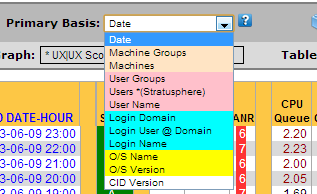
Two of the more powerful Primary Basis I think is User Group and Machine Group. Within Stratusphere you can define groups either manually or imported from Active Directory. These groups usually are logical areas of your environment which have similar functions. For example a Sales or Development group. Using a Primary Basis on User Group or Machine Group you can quickly get an overview of the metrics and performance of those groups as a whole.
Custom Basis
The Primary Basis is the main grouping method for your inspector data and that works great. But now what if you want to see additional groupings of data as your view and analysis the metrics?
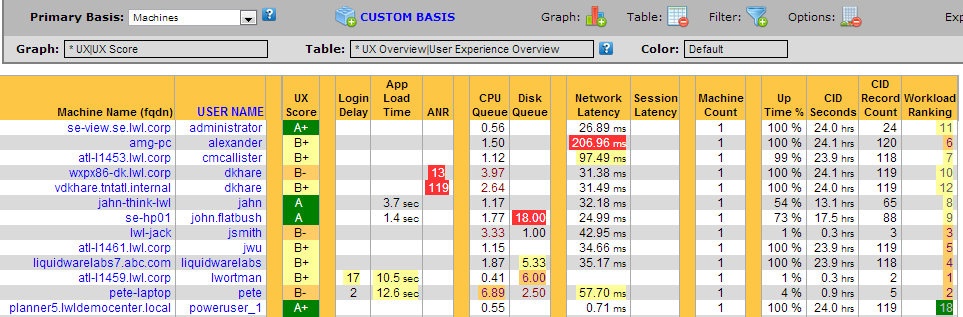
For example, let’s assume you are looking at your data by Machine as shown below. Wouldn’t it be nice to then group by the User Name or any of the other Primary Basis options? With the 5.5 Stratusphere release of the Preview Inspectors we have introduced Custom Basis to provide this functionality.
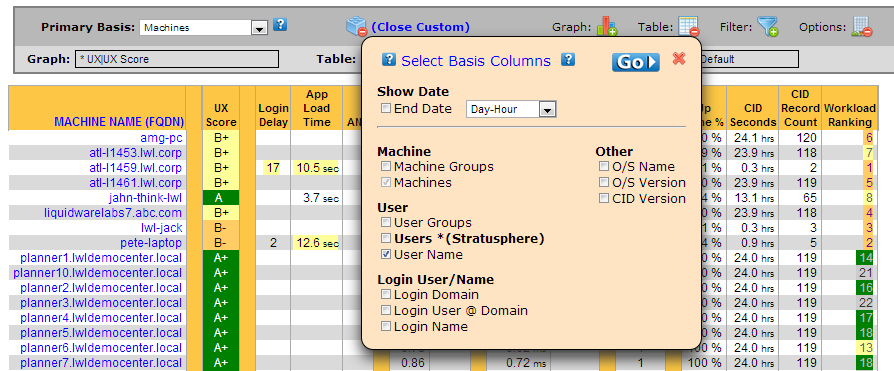
When you click on Custom Basis it shows the above box where you can now add in any of the other basis options simply by checking them. They will be added to your data results as new columns starting with column two.
In this example we have added User Name as a custom basis. So now you can see your data first by Machine Name and then by User Name. This is very powerful and provides you complete flexibility in how you want to group and view your Stratusphere metric data.
New Data
Earlier in the blog we discussed the new Tab approach for the preview inspectors. Along those tabs you will see a lot of new information that is collected by Stratusphere UX and is now available to be viewed and analyzed within the Preview Inspector Format.
![]()

These new tabs are:
- PCOIP
- Hosts
- Storage
- Folders
- Extensions
- VCOPS
Let’s look at a few of these new tabs in more detail.
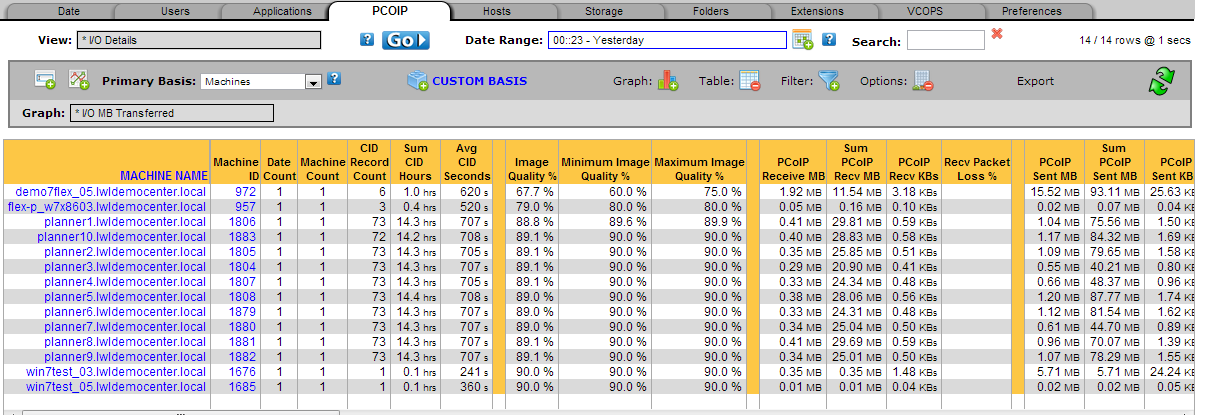
PCoIP (PC-Over-IP) is a remote display protocol for delivering remote desktops and applications to endpoints. It is commonly used in VMware Horizon View Installations. The Stratusphere UX Connector ID can capture this information and it is viewable in the new PCOIP tab. Here you see metrics like Image Quality and PCoIP MBs sent and received as well as Packet Loss percentages.
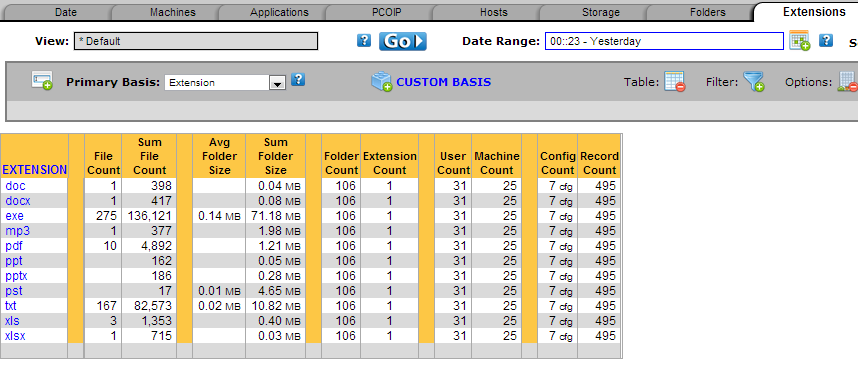
Another new tab added is the Extensions tab. One nice feature of the Stratusphere Connector ID (CID) is its ability to capture data about the files located on your desktop. Within Stratusphere you can indicate which folders and which types of files (extensions) you want to report on.
The Extensions tab provides an easy way to review this data. In the below example it is showing file information group by file extensions ( docx, exe, pdf, ppt and others ).
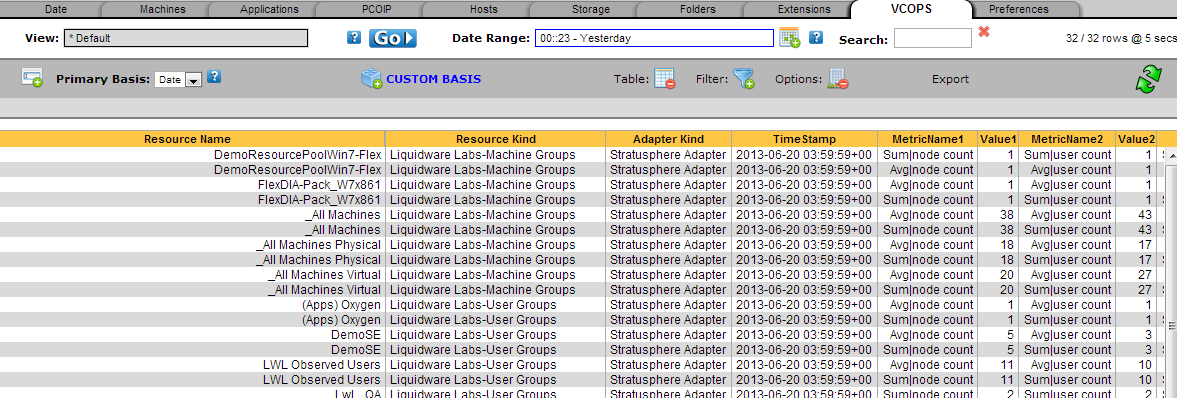
Recently we introduced a VMware vCenter Operations (vCops) data feed from Stratusphere. This has been received with a lot of positive feedback by the users running the vCops feed. This enables you see the various metrics that Stratusphere captures inside your vCops dashboards.
In Stratusphere 5.5 what we have added is a new vCOPS inspector showing exactly what data you have selected to export from Stratusphere to vCops. This can be very helpful in a debugging situation where you are trying to find data you believe should be in vCops against the actual Stratusphere vCops feed. It can also be useful is just cross checking what you are sending from Stratusphere to vCops straight from your Stratusphere Preview Inspector interface.
Toggle Graphs and Tables
The last area of the 5.5 Preview Inspector releases I wanted to review is some of the ways we give you complete flexibility in how you want your inspector interface to look and feel. One way we do this is being able to toggle on and off various viewing options as well as with the Preferences tab. In this blog I want to look at the toggle options.
![]()

For each Stratusphere inspector there are two main methods from viewing your data. That is in a table form or in a graph form. Within each we have multiple views and graphs. You can toggle on or off each of these. For example if you only want to work with the graph you can toggle off the Table. Conversely if you just want the table view you can toggle off the graph. Of course both can also be active together.
Other areas you can toggle and off are further detailed selection methods. The first being the various Filters available.
![]()

The second are is the Options toggle where you have the ability to select various different graphs and the graph color scheme.
![]()

Summary
These are some of the new and exciting features and functions with the Stratusphere UX 5.5 Preview Inspectors. For more information on the Stratusphere UX 5.5 release and the Preview Inspectors you can check out the Stratusphere UXÂ products page on the Liquidware Labs web site.
Pete Del Rey
Technology Evangelist
Liquidware Labs