Today Liquidware Labs released, Stratusphere UX  version 5.4. The new release included some important new features and enhancements. The full list is outlined in the Stratusphere 5.4 Release Notes.
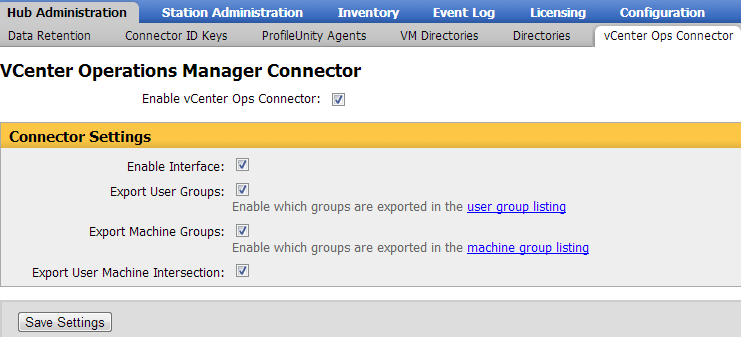
One new feature added that I wanted to highlight is the introduction of new data feeds to VMware vCenter Operations (vCops). Previously the Liquidware Labs adapter’s feed would group its metrics by Stratusphere User Groups only. Now in 5.4 there are 3 options for grouping exported metrics to vCops.
- Exporting User Groups – This is the original method, which will feed selected Stratusphere User Groups to vCops with the metrics summarized by each user group.
- Exporting Machine Groups – Now you can select Stratusphere Machine Groups for export and feed metrics to vCops summarized by these machine groups.
- User/Machine Intersection – This is an interesting option and provides some real flexibility in how your vCops feed works. If this is enabled it will also organize the various metrics by the combination of User and their machine. You will see in vCops a Resource Kind that looks like format:
User Name@domain::Machine Name
** Note – for the Intersect feed it will only work for users and their machines that are included in Stratusphere User Groups and Machines Groups that are enabled for vCops export.
With Machine groups being added this opens up some new functionality and analysis possible in vCenter Operations. Machine groups can automatically be tied to VMware Resource Pools and User level data can be fed into vcops for users within these machine groups. The result is enabling of vcops root cause analysis and health tree / relationship features. See screen shot below:
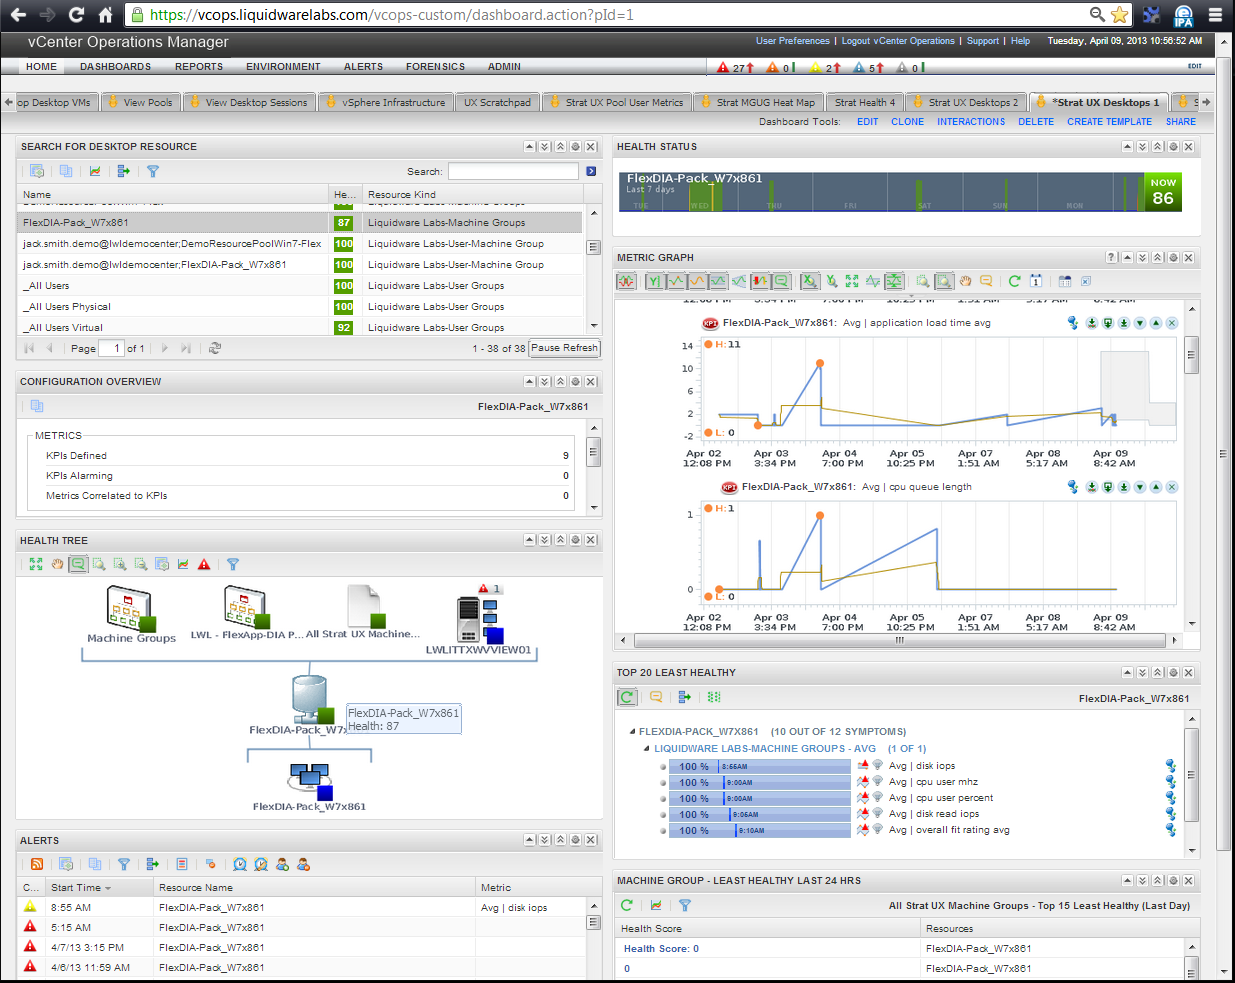
Let’s walk through this Dashboard and see how the Stratusphere data feeds combined with the vCops widgets on the dashboard can be used for analysis. (Note: vCops Dashboards are not part of the LWL Adapter, they need to be built in vCenter Operations).
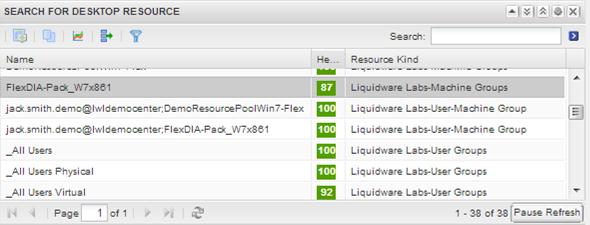
Search for User or Pool
First look for your user group or machine group of interest for analysis and select it. Resource kinds listed as ‘Liquidware Labs-User-Machine Groups’ are the intersect resource kinds being fed.
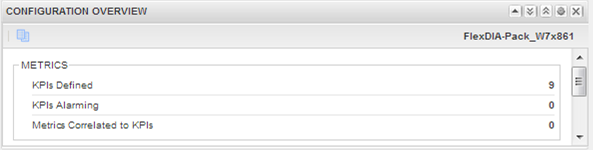
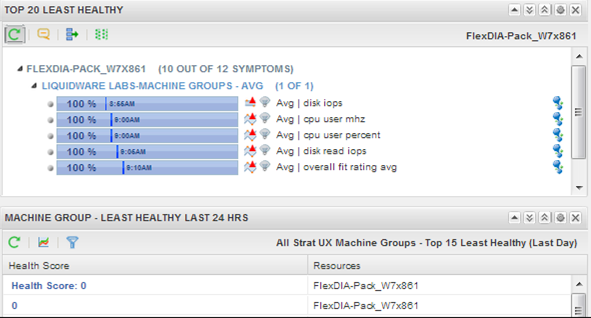
Check for current KPI (Stratusphere UX KPI) violations
Following to the next dashboard widget, look for any Key Performance Indicates (KPI) violations. It is important to note they are time-based from Stratusphere UX.
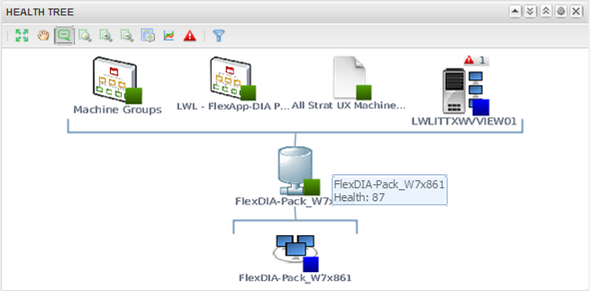
Health Tree Relationships
This shows the relationships to VM’s and others resources. You can browse in any of these and hover over them to see their health.
Health Tree Alerts
Underneath the Heath Tree on the dashboard it shows any Alerts for whatever resource you have selected in the health tree. In this example there is a warning for the Stratusphere UX metric, disk iops.
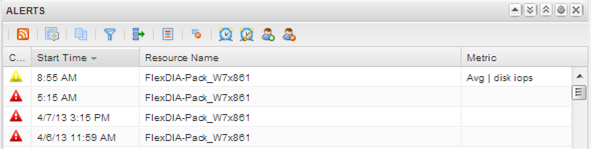
You can see other Stratusphere UX metric feeds per user and or pool alarming in this window so you can drill and investigate Stratusphere UX user metrics further within vcops!
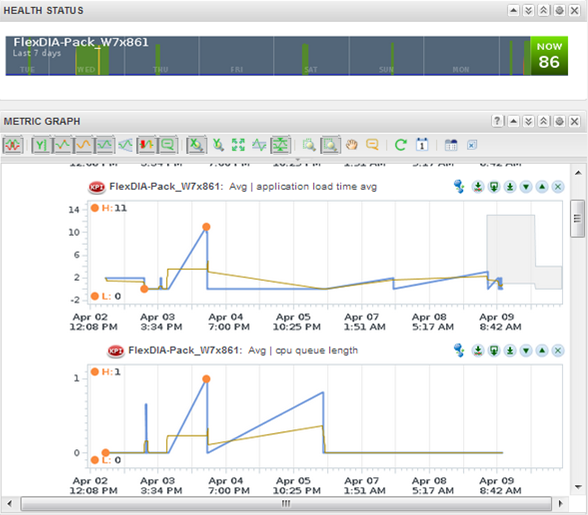
Health Status and Metric Graphs
On the right side of the dashboard it shows the over Health Status over the last 7 days of the resource selected. The blue is when the user is NOT logged in. You can see the current user health is 86 and then investigate the kpi’s and specific metrics in the widget below the Health Status using the Metric Graph.
In this example it is graphing ‘Application Load time average’ and ‘CPU queue length’.
For additional information on Liquidware Labs Stratusphere UX and its vCops Adapter refer to the Stratusphere UX Products Page.
Pete Del Rey
Technology Evangelist
Liquidware Labs


Leave A Comment
You must be logged in to post a comment.